Author

admin

Browsing

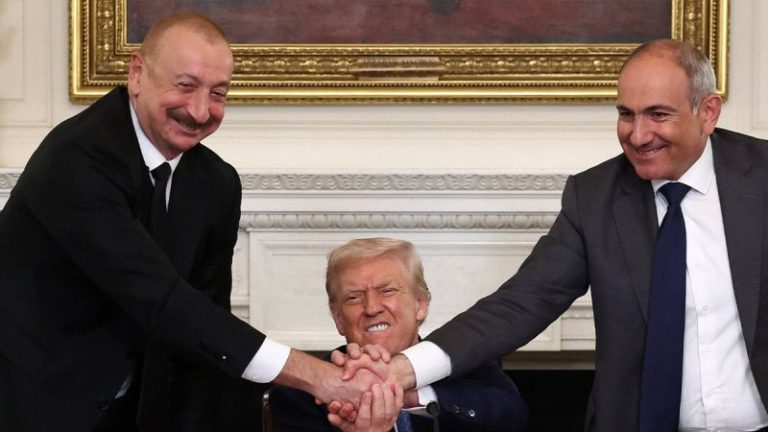
The leaders of Armenia and Azerbaijan brushed off any threat of backlash from neighboring powers Iran and Russia following a U.S.-brokered peace accord – an agreement hailed as the start of a new era, ending more than three decades of war and hostility in the South Caucasus.

In exclusive Fox News Digital interviews, Armenian Prime Minister Nikol Pashinyan and Azerbaijani President Ilham Aliyev both praised President Donald Trump and his envoy for their role in brokering the framework agreement. They emphasized that the deal, which promised increased regional economic integration and political cooperation, is not directed at any third party – and may actually provide strategic advantages to Moscow and Tehran.

‘This is not a zero-sum game,’ Pashinyan said. The agreement ‘contains quite tangible benefits for Iran and for Russia as well.’

‘Iran would have access through railway from the Persian Gulf to the Black Sea and Russia and Iran will have opportunity to have a railway connection between the two countries.’

Russia – a long-standing ally of Armenia and a presence in the region through its border guards – welcomed peace but sent a warning about U.S. involvement. Its foreign ministry described the accord as ‘positive,’ expressing hope for stability in the Caucasus, but warned that foreign involvement should complement, not complicate, the peace process. 

The ministry emphasized that regional solutions should include neighbors like Russia, Iran and Turkey, and cautioned against repeating the pitfalls of Western-led interventions in the Middle East.

Aliyev echoed Pashinyan’s remarks and declined to see U.S. diplomatic involvement as a provocation toward Moscow. 

‘It will be very difficult for any country – whether far away or in our region – to say something bad about today’s agreement,’ he told Fox News Digital.’We’ve taken the final step toward peace.’ 

He added: ‘It’s not against anyone. It’s a connectivity project which will be one of the most important parts of international transportation.’

At the heart of the pact is the planned Trump Route for International Peace and Prosperity (TRIPP) – a roughly 27-mile transit route linking mainland Azerbaijan with its Nakhchivan exclave, passing through Armenian territory. Armenia has granted the U.S. exclusive development rights via a 99‑year lease, allowing for infrastructure projects such as roads, rail lines, pipelines, fiber optics and possibly power transmission, aimed at opening new trade and transit paths in the region.

This bold move shifts regional dynamics, offering Washington a powerful strategic foothold while bypassing traditional Russian and Iranian routes.

Iran, in contrast, has responded with hostility. 

Ali Akbar Velayati, a key advisor to Iran’s supreme leader, warned of serious consequences if the ‘Zangezur Corridor’ – as Iran calls the route – is enacted, asserting that it ‘will not become a passage owned by Trump, but rather a graveyard for Trump’s mercenaries,’ according to the semi-official news agency Tasnim.

Iran has even signaled readiness to use military means to block the route. 

Domestically, Pashinyan faces opposition. Armenian nationalists, already fierce critics of any deal with Azerbaijan, view the agreement as a betrayal. The Republican Party of Armenia has declared that Pashinyan lacks the mandate to sign such a treaty, demanding full transparency and an end to concessions made under external pressure.

Pashinyan, however, is undeterred. He said the accord could transform Armenia’s investment climate and attract foreign capital. 

‘We expect to have some criticism, and that’s part of democracy,’ he told Fox News Digital. ‘But we are confident we made the right decision.’ 

Once the dominant power in the South Caucasus, Russia is losing its grip. The war in Ukraine, mounting sanctions and resource strains have depleted its regional influence, enabling the U.S., Turkey and the European Union to expand their diplomatic reach.

Relations with Azerbaijan particularly soured following the December 2024 downing of Azerbaijan Airlines Flight 8243. Aliyev accused Moscow of accidentally shooting the passenger jet with Russian air defenses during operations against Ukrainian drones, killing 38 people. 

Aliyev told Fox News Digital he didn’t believe the incident was an intentional attack by Russian leadership, but demanded a formal admission of guilt, punishment for those responsible and full compensation – moves Russia has resisted, apologizing only vaguely for what they called a’tragic incident.’

And amid political divisions, Pashinyan finds himself in a conflict with one of the country’s most respected institutions  – the Armenian Apostolic Church, where figures like Archbishop Bagrat Galstanyan have led public protests against Pashinyan’s decision to return border villages to Azerbaijan.

On June 25, authorities arrested Galstanyan, a leading figure in the church and of the ‘Sacred Struggle’ opposition movement, accusing him of orchestrating a terrorist plot to overthrow the government. Armenia’s Investigative Committee alleged he had recruited more than 1,000 former police and military personnel to stage bombings, disrupt power grids and paralyze transportation networks. 

Pashinyan assured that the judiciary system acted independently of his government and ‘in full accordance with the law of Armenia, respecting all the rights of all people.’

This post appeared first on FOX NEWS

The Trump administration is announcing the launch of a new tool it says will be instrumental in enabling agencies across the federal government to efficiently implement artificial intelligence at scale and take a major step forward rolling out the president’s ‘AI Action Plan.’

Trump’s U.S. General Services Administration (GSA) said on Thursday it has launched USAi, a tool the agency describes as a ‘secure generative artificial intelligence evaluation suite that enables federal agencies to experiment with and adopt artificial intelligence at scale—faster, safer, and at no cost to them.’

The agency says that the platform, available starting Thursday at 10 a.m. through USAi.gov, gives government users access to ‘powerful’ tools like chat-based AI, code generation and document summarization with the goal of ‘supercharging employee productivity.’

‘USAi isn’t just another tool, it’s infrastructure for America’s AI future,’ GSA Chief Information Officer David Shive explained. ‘USAi helps the government cut costs, improve efficiency, and deliver better services to the public, while maintaining the trust and security the American people expect.’

GSA Deputy Administrator Stephen Ehikian told Fox News Digital that this latest application is an ‘on ramp’ to A.I. that will be the ‘tip of the spear’ on the A.I. front similar to the way GSA previously implemented the cloud. 

The Trump administration rolled out its A.I. Action Plan in July after Trump ordered the federal government in January to develop a plan of action for artificial intelligence in order to ‘solidify our position as the global leader in AI and secure a brighter future for all Americans.’ 

Trump has made U.S. A.I. growth a cornerstone of his administration, such as notching multi-billion deals with high-tech firms such as Oracle and OpenAI for the Stargate project, which is an effort to launch large data centers in the U.S, as well as a $90 billion energy and tech investment deal specifically for the state of Pennsylvania to make it the U.S. hub for AI. 

‘USAi means more than access—it’s about delivering a competitive advantage to the American people,’ GSA Deputy Administrator Stephen Ehikian said in press release.

‘The launch of USAi shows how GSA is translating President Trump’s AI strategy into action and accelerating AI adoption across government. USAi will put mission-ready tools directly into the hands of agencies to modernize faster, boost security, and lead globally.’

The A.I. Action Plan includes a three-pillar approach focused on American workers, free speech and protecting U.S.-built technologies. 

‘We want to center America’s workers, and make sure they benefit from AI,’ A.I. and crypto czar David Sacks told the media in July when details of the A.I. plan were made public. 

‘The second is that we believe that AI systems should be free of ideological bias and not be designed to pursue socially engineered agendas,’ Sacks said. ‘And so we have a number of proposals there on how to make sure that AI remains truth-seeking and trustworthy. And then the third principle that cuts across the pillars is that we believe we have to prevent our advanced technologies from being misused or stolen by malicious actors. And we also have to monitor for emerging and unforeseen risks from AI.’

Advancing the federal government’s use of A.I. and expanding employee access are core to the GSA’s efforts to fulfill Trump’s directive to preserve U.S. leadership in the global technology race, GSA Commissioner Josh Gruenbaum explained to Fox Digital in an interview earlier this month. 

‘As we kind of examined the President’s AI action plan, heard the call to action of, ‘Hey, this is a race, and we are going to win this race.’ From our perspective, all that meant, synonymously, was widespread adoption,’ he told Fox Digital of delivering AI to federal employees. 

The rollout of the USAi tool follows GSA announcing earlier in August that OpenAI’s ChatGPT Enterprise is now available to all federal agencies to incorporate into their workflow at $1 per agency. The deal with OpenAI, the tech company behind ChatGPT, is part of GSA’s OneGov Strategy that aims to modernize ‘how the federal government purchases goods and services’ under the Trump administration. 

GSA also notched another deal with A.I. company Anthropic this month providing all three branches of government access to large language model Claude. 

Gruenbaum told Fox News Digital that Thursday’s announcement will be critical for agencies for creating efficiencies to help turn the federal workforce into ‘the most nimble, smart, efficient, agile, and agentically tech-forward workforce out there so that this country can continue to compete and win the AI race.’

This post appeared first on FOX NEWS

President Donald Trump has pledged to protect and preserve Social Security, and I am honored to lead the agency as Commissioner at such a pivotal moment. My vision is straightforward: a Social Security Administration that is easier to access, faster to respond, and better prepared to meet the challenges of tomorrow. That vision is rooted in our commitment to public service and grounded in the belief that government can and should work for everyone.

Since taking office, I have focused on modernizing operations; investing in our workforce; eliminating fraud, waste, and abuse; and improving how we serve the public, whether online, over the phone, or in person. 

Social Security is not a program of the past; it is a promise to future generations. 

We have expanded our digital tools to provide more services from the convenience of people’s homes. We have taken steps to reduce wait times, enhance security, and make it easier to navigate our programs. All the while ensuring we pay benefits accurately to those who are eligible to receive them.

We have also added support and removed roadblocks for our frontline employees with updated tools, technology, and processes, so they can deliver efficient, accurate, and compassionate service to the American people every day.

In my first 100 days as Commissioner, SSA has made significant progress, improving customer experience: reducing the average wait time on the national 800 number from 30 minutes last year to single digits last month; implementing new phone systems to enable 90% of calls to be handled via self-service or convenient callbacks; shortening field office wait times by 30%; eliminating 29 hours of weekly downtime for my Social Security to allow 24/7 online management of benefits; decreasing Disability hearing wait times by 60 days, reaching historic lows; and, sending over 3.1 million payments totaling $17 billion to eligible beneficiaries five months ahead of schedule under the Social Security Fairness Act.

We have a clear path to achieving operational excellence and providing best-in-class service. Under President Trump’s leadership, I have charted a new course that strengthens service delivery and secures the integrity and efficiency of our systems. We are modernizing the underlying infrastructure that supports our work so that the agency is not only keeping up with the pace of change but leading the way in service innovation.

As we celebrate this 90th anniversary, we must also keep our eyes firmly on the future. Social Security is not a program of the past; it is a promise to future generations. 

Young Americans entering the workforce today deserve the same sense of security their parents and grandparents had. Maintaining that trust will require thoughtful innovation and a shared commitment to protecting the integrity and solvency of the program.

As we look to the century ahead, President Trump remains committed to ensuring that Social Security is as strong, effective, and enduring for our children and grandchildren as it has been for the generations before them.

This post appeared first on FOX NEWS

Is the market’s next surge already underway? Find out with Tom Bowley’s breakdown of where the money is flowing now and how you can get in front of it.

In this video, Tom covers key moves in the major indexes, revealing strength in transports, small caps, and home construction. He identifies industry rotation signals, which are pointing to aluminum, recreational products, and furnishings. Tom then demonstrates how to use StockCharts’ tools to scan for momentum stocks in emerging leadership groups — see why SGI tops Tom’s list. He ends with a discussion of post-earnings reactions from major names like GOOGL, TSLA, IBM, and LVS. 

And, of course, Tom wraps every idea with clear chart setups you can act on today. 

This video premiered on July 24, 2025. Click this link to watch on Tom’s dedicated page.

Missed a session? Archived videos from Tom are available at this link.

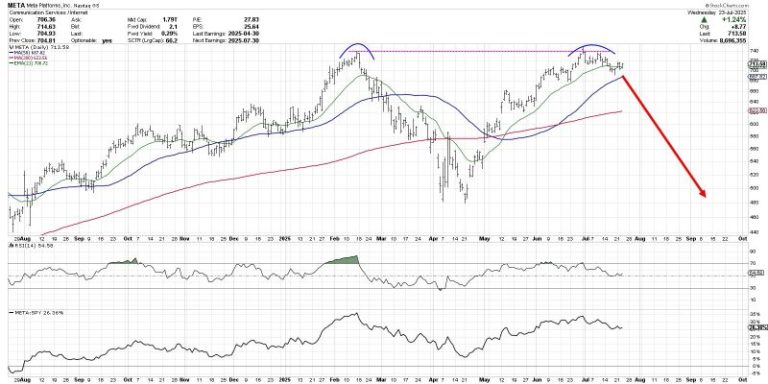
The chart of Meta Platforms, Inc. (META) has completed a roundtrip from the February high around $740 to the April low at $480 and all the way back again.  Over the last couple weeks, META has now pulled back from its retest of all-time highs, leaving investors to wonder what may come next.

Is this the beginning of a new downtrend phase for META?  Or just a brief pullback before a new uptrend phase propels META to new all-time highs?

Today we’ll look at two potential scenarios, including the double top pattern and the cup and handle pattern, and share which technical indicators and approaches could help us determine which path plays out into August.

The double top scenario basically means that the late July retest of the previous all-time high was the end of the recent uptrend phase.  The double top pattern is literally when a major resistance level is set and then retested.  The implication is that a lack of willing buyers means the uptrend is exhausted, and there is nowhere to go but down.

While the 21-day exponential moving average is currently in play for META, I would say that a break below the 50-day moving average could confirm this as the correct scenario.  If that smoothing mechanism does not hold, then the price action would imply less of a pullback and more like the beginning of a real distribution phase.

What is META pulls back but then resumes an uptrend phase, leading META to another new all-time high?  That would result in a confirmed cup and handle pattern, created by a large rounded bottoming pattern followed by a brief pullback.  The key to this pattern is the “rim” of the cup, which sits right at $740 for META.

Given the pullback META has demonstrated so far in July, I would say that a break above the $740 level would basically confirm a bullish cup and handle pattern.  That would suggest much more upside potential for META, as the stock would literally go into previously uncharted territory.

So how can we determine which scenario is more likely to play out?  This is where we need to incorporate more technical indicators into the discussion, as a way to further validate and confirm our investment thesis.

Just to review, I think a break above $740 would confirm a bullish cup and handle pattern.  I would also say that a break below the $680 level, which would represent a move below the 50-day moving average as well as the June swing lows, would basically confirm a bearish double top pattern.

We can also use the Relative Strength Index (RSI) to help determine whether META remains in a bullish trend phase.  During bull phases, the RSI rarely gets below 40, because buyers usually step in to “buy the dips” and keep the momentum fairly constructive.  So if the price would break down, and the RSI would not hold that crucial 40 level, that could mean a bearish outlook is warranted.

Finally, we can use volume-based indicators to assess whether moves in the price are supported by stronger volume readings.  Here I’ve included the Accumulation/Distribution Line, which tracks the trend in daily volume readings over time.  We can see that the high in July resulted in a divergence, as the A/D line was trending lower.  If the A/D line would break below its June and July lows, marked by a dashed red line, that would represent a bearish volume reading for META.

Technical analysis is less about predicting the future, and more about determining the most probable scenarios based on our analysis of trend, momentum, and volume.  I hope this discussion shows how the outlook for META can be easily determined and tracked using the best practices of technical analysis!

RR#6,

Dave

PS- Ready to upgrade your investment process?  Check out my free behavioral investing course!

David Keller, CMT

President and Chief Strategist

Sierra Alpha Research LLC

marketmisbehavior.com

https://www.youtube.com/c/MarketMisbehavior

Disclaimer: This blog is for educational purposes only and should not be construed as financial advice.  The ideas and strategies should never be used without first assessing your own personal and financial situation, or without consulting a financial professional.  

The author does not have a position in mentioned securities at the time of publication.    Any opinions expressed herein are solely those of the author and do not in any way represent the views or opinions of any other person or entity.

Markets don’t usually hit record highs, risk falling into bearish territory, and spring back to new highs within six months. But that’s what happened in 2025.

In this special mid-year recap, Grayson Roze sits down with David Keller, CMT, to show how disciplined routines, price-based signals, and a calm process helped them ride the whipsaw instead of getting tossed by it. You’ll see what really happened under the surface, how investor psychology drove the swings, and the exact StockCharts tools they leaned on to stay objective. 

If you’re focused on protecting capital, generating income, and sleeping well at night while still capturing the upside, this is a must-watch. Discover which charts deserve your attention now, what to ignore, and how to prep for the back half of 2025. 

This video premiered on July 23, 2025. Click on the above image to watch on our dedicated Grayson Roze page on StockCharts TV.

You can view previously recorded videos from Grayson at this link.

GMV Minerals Inc. (the ‘Company’ or ‘GMV’) (TSXV:GMV)(OTCQB:GMVMF) is pleased to announce positive results from the updated Preliminary Economic Assessment (‘PEA’) study of the Mexican Hat Gold Project (the ‘Mexican Hat Project’), located in Cochise County, southeastern Arizona.

A National Instrument 43-101 –Standards of Disclosure for Mineral Projects (‘NI 43-101’) compliant technical report (the ‘Report’) entitled ‘Updated NI 43-101 Technical Report Preliminary Economic Assessment, Mexican Hat Project’ with an effective date of August 8, 2025 will be filed on SEDAR+ at www.sedarplus.ca under the Company’s profile within 45 days of this news release. All amounts are stated in second quarter 2025 US dollars (US$).

The Mexican Hat hosts a shallow oxide gold resource with excellent metallurgy and high recoveries, supported by a low strip ratio and minimal pre-stripping. Infrastructure is in place and the Mexican Hat Project demonstrates a robust NPV and IRR. With fast leach kinetics and low reagent consumption, the Company believes the Mexican Hat Project offers exceptional potential economics.

Highlights:

    • Based on price sensitivity analysis at approximately the current price of US$3,350 per ounce of gold, the project returns a pre-tax IRR of 106.8% (after-tax 82.5%) and a pre-tax NPV at a 5% discount rate of US$767 million (after-tax US$538.1 million) with a payback period of 1.10 years (1.3 years after-tax).
    • Base Case mine life of 10 years with total production of 597,841 ounces, averaging approximately 60,000 ounces per year.
    • Crushed mineralized material will be conveyor stacked at a rate of approximately 10,000 tonnes/day on a conventional heap leach pad.
    • Capex: US$89,997,000 (including US$15.4 million contingency).
    • Opex: US$788 million LOM with Low LOM Strip Ratio of 2.05
    • Estimated cash cost of production is US$1,354 per ounce with an all-in-sustaining cost of $1,545 per ounce inclusive of sustaining capital and additional overhead support.
    • Engineering design analysis indicates the potential to increase pit size and contained ounces with increased gold prices.

    FINANCIAL INDICATORS

    The following table summarizes the financial indicators for the Mexican Hat Project for both before and after taxes.

    Financial Indicators Before Taxes

    Values

    NPV cash flow (undiscounted)

    US$537.7M

    NPV @ 5%

    US$390.2M

    IRR %

    66.1%

    Payback (years)

    1.53

    Financial Indicators After Taxes

    Values

    NPV cash flow (undiscounted)

    US$377.9M

    NPV @ 5%

    US$268.3M

    IRR %

    50.2%

    Payback (years)

    1.82

    GOLD PRICE SENSITIVITY TABLE (US$ MILLIONS)

    The following table summarizes the pre-tax and post-tax economic results to gold price sensitivity.

    Pre-Tax and Post-Tax Sensitivity to Gold Price

    -60%

    -45%

    -30%

    -15%

    Base

    +15%

    +34%

    +45%

    +60%

    US$/troy oz Gold

    1,000

    1,375

    1,750

    2,125

    2,500

    2,875

    3,350

    3,625

    4,000

    IRR (Pre-Tax)

    18.3%

    45.0%

    66.1%

    85.0%

    106.8%

    118.7%

    134.2%

    NPV @ 5% (Pre-Tax) US$M

    -274.7

    -108.5

    57.7

    224.0

    390.2

    556.4

    767.0

    888.9

    1,055.1

    IRR (Post-Tax)

    11.3%

    33.4%

    50.2%

    65.2%

    82.5%

    91.9%

    104.2%

    NPV @ 5% (Post-Tax) US$M

    -274.9

    -117.3

    25.8

    149.3

    268.3

    387.4

    538.1

    625.4

    744.4

    INITIAL CAPITAL EXPENDITURES (US$ MILLIONS)

    Initial capital expenditures are estimated at US$89,997,000 million as detailed below:

    OPERATING COSTS

    The mine operating costs were calculated to average $3.49 per tonne mined as summarized below.

    Mine Operating Cost Center

    Unit Cost (US$/t mined)

    Owner Mining Personnel

    $0.11

    Owner Supplies & Misc.

    0.03

    Contractor Mining

    3.35

    Total Cost (Rounded)

    $3.49

    The life-of-mine operating costs were calculated to average US$20.44/tonne resource processed as summarized below.

    Operating Cost

    Cost per Tonne of Crushed Material Processed (US$/t)

    Mining

    $10.60

    Processing

    $8.79

    G&A

    $1.05

    Total Site Operating Cost

    $20.44

    MINERAL RESOURCES

    An updated Mineral Resource Estimate prepared by DRW Geological Consultants Ltd., with an effective date of August 8, 2025, was used in the PEA. Details of the Mineral Resource Estimate can be found in the Report to be filed on SEDAR+ within 45 days of this release.

    Category

    Cut-off (g/t Au)

    Grade (Au, g/t)

    Tonnes

    Gold Oz

    Strip Ratio

    Inferred

    0.20

    0.58

    36,733,000

    688,000

    2.36

    • The Mineral Resource Estimate has been constrained to a preliminary optimized pit shell, using the following parameters: SG = 2.57 gm/cc based on testwork, mining costs = $3.00/tonne, mining recovery = 98%, mining dilution = 2%, process cost = $5.00 per tonne, G&A = $1.05 per tonne, gold price = $2,500 per troy ounce, throughput at 10,000 tpd., discount rate = 5%. A cost of $0.03 was added per bench to the mining cost below the existing level surface.
    • A top cut of 32 gpt gold is applied to all zones except Zone 6 which has a top cut of 50 gpt gold.
    • Mineral Resources have been calculated using the Inverse Distance Squared method.
    • Mineral Resources constrained to optimized pit shells are not Mineral Reserves and do not have demonstrated economic viability.
    • Conforms to NI 43-101, Companion Policy 43-101CP, and the CIM Definition Standards for Mineral Resources and Mineral Reserves. Inferred Resources have been estimated from geological evidence and limited sampling and must be treated with a lower level of confidence than Measured and Indicated Resources.
    • All numbers are rounded. Overall numbers may not be exact due to rounding.
    • There are no known legal, political, environmental, or other risks that could materially affect the potential development of the mineral resources.

    MINE PLAN

    The mine plan is conceived as a conventional open pit tuck and shovel/loader operation. There are two independent pits which are developed with five-phase or pushback designs. Pit shells were designed using 6.0-meter benches with a catch bench installed every 18 meters. A bench face angle of 66° was used, resulting in an inner-ramp angle of 45° when catch benches were included. An 88% overall gold recovery has been used in this study, which was based on bottle roll and column leach test results. Base case haulage ramps are 26 meters wide and have a design gradient of 10%. Processing rates are based on a daily crushing rate of approximately 10,000 tonnes per day utilizing two stage crushing

    The mine and crushing will be operated by contractors with oversight by GMV mine management. The mine plan produces a nominal tonnage to the crushing and heap leach of 3,500 Ktonnes per year (10,000 tpd) from a total material movement of 93.8 Ktonnes for the life of mine (26,106 tpd LOM average).

    The PEA is preliminary in nature; it includes inferred Mineral Resources that are considered too speculative geologically to have the economic considerations applied to them that would enable them to be categorized as Mineral Reserves, and there is no certainty that the PEA will be realized. There is no Mineral Reserve at the Mexican Hat Project at this time. Mineral resources that are not mineral reserves do not have demonstrated economic viability. Over the course of the mine life, 38.6 Mtonnes of Mineralized Resource is planned for processing out of a total material movement of 117.8 Mtonnes.

    INFRASTRUCTURE & PROCESS PLANT

    The Mexican Hat Project is located in the southeastern part of the State of Arizona, approximately 72 miles east-southeast of Tucson, and can be accessed from the Old Ghost Town Road., a gravel road extending south of the Town of Pearce or north from Gleeson Road.

    Groundwater will be used as the source of water for mining operations. No permitting restrictions or quantity issues are anticipated.

    A 69 kV powerline to site will be supplied by Sulphur Springs Valley Electric Cooperative from their power plant located 30 km north of the project site.

    The crushing plant will be operated by a contractor to produce a crushed product for heap leaching with a 25 mm top size. Pregnant solution from the heap leach will be processed in a conventional adsorption desorption recovery (ADR) plant. The process plant will produce doré gold bars.

    TECHNICAL REPORT AND QUALIFIED PERSONS

    The Report entitled Updated Preliminary Economic Assessment, Mexican Hat Project’, with an effective date of August 8, 2025 and which was prepared by the following Qualified Persons (as defined under NI 43-101), all of whom are independent of the Company, will be filed by the Company within 45 days of this release on www.sedarplus.com:

    • Mr. Brian Olson, Q.P., Samuel Engineering, Inc. (Metallurgical Test Work and Recovery, Process Plant and Process Operating Costs)
    • Mr. Steven Pozder, P.E., Samuel Engineering, Inc. (Project Economics and Infrastructure)
    • Dr. Dave Webb, Ph.D., P.Eng., P.Geo., DRW Geological Consultants Ltd. (Mineral Resource Estimate, Property Description and Location, Accessibility, Climate, Local Resource, Infrastructure and Physiography, History, Geological Setting and Mineralization, Deposit Types, Exploration, Drilling, Sample Preparation, Analysis and Security, Data Verification).
    • Mr. Thomas L. Dyer, P.E., RESPEC LLC. (Mine Design, Production Schedule, Capital and Operating Costs)
    • Mr. Francisco J. Barrios, P.E., BBA Consultants International LP (Pad Design and Loading)
    • Ms. Dawn Garcia, CPG, PG, Stantec Consulting Services Inc. (Environmental)

    All Qualified Persons have contributed to their corresponding sections in Interpretation, and Recommendations. The Qualified Persons have reviewed and approved the scientific, technical, and economic information obtained in this news release.

    For a description of the data verification process and limitations, underlying assumptions and the results of surveys and quality assurance program regarding exploration information, please refer to the Company’s existing NI 43-101 Technical Report filed on SEDAR+ entitled ‘Preliminary Economic Assessment, Mexican Hat Project’ with an effective date of October 20, 2020.

    Ian Klassen, President & CEO remarked that ‘The robust PEA confirms our contention that the project’s strong economic potential de-risks the development pathway, providing a solid foundation for advancement. The results validate the open-pit, heap-leach concept, demonstrate excellent metallurgy and recoveries, and outline a simple mining and processing strategy. With high margins, rapid payback, and straightforward engineering, the PEA positions the project well for the future, where detailed design, capital optimization, and permitting can advance with confidence.’

    2025-2026 Forward Looking Plan

    The Mexican Hat Project PEA economics justify continued investment in project development. The forward-looking plan for Mexican Hat includes work required to advance the project through Feasibility Study and into the permitting process.

    These tasks include:

    • Approx. 7000 meters of in-fill drilling to increase confidence in the current geological understanding and mineral resource estimation to sufficient level to support mineral reserve development
    • Metallurgical column, hardness, and grinding tests to further optimize and improve heap leach gold recovery, and to provide information for feasibility design work
    • Performing a trade-off study for self-mining and crushing versus contract mining and crushing
    • Geotechnical drilling and analysis to optimize pit slope design parameters
    • Conduct base-line water sampling, and update of hydrologic, cultural, and environmental studies for permitting

    About GMV Minerals Inc.

    GMV Minerals Inc. is a publicly traded exploration company focused on developing precious metal assets in Arizona. GMV, through its 100% owned subsidiary, has a 100% interest in a Mining Property Lease commonly referred to as the Mexican Hat Project, located in Cochise County, Arizona, USA. The project was initially explored by Placer Dome (USA) in the late 1980’s to early 1990’s. GMV is focused on developing the asset and realizing the full mineral potential of the property through near term gold production.

    PEA Information and Cautionary Note Regarding Inferred Mineral Resources

    The mine plan evaluated in the PEA is preliminary in nature and includes Inferred Mineral Resources, as defined by NI 43-101 that are considered too speculative geologically to have the economic considerations applied to them that would enable them to be converted to Mineral Reserves. Additional drilling and technical studies will need to be completed in order to fully assess its viability. There is no certainty that a production decision will be made to develop the Mexican Hat Project or that the economic results described in the PEA will be realized. Mine design and mining schedules, metallurgical flow sheets and process plant designs will require additional detailed work and economic analysis and internal studies to ensure satisfactory operational conditions and decisions regarding future targeted production.

    Cautionary Note to U.S. Investors

    The United States Securities and Exchange Commission permits U.S. mining companies, in their filings with the SEC, to disclose only those mineral deposits that a company can economically and legally extract or produce. We use certain terms in this report, such as ‘measured,’ ‘indicated,’ ‘inferred,’ and ‘resources,’ that the SEC guidelines strictly prohibit U.S. registered companies from including in their filings with the SEC.

    Cautionary Statement Regarding Forward-Looking Information

    This news release includes certain ‘forward-looking information’ under applicable Canadian securities legislation. Forward-looking information include estimates and statements that describe the Company’s future plans, objectives or goals, including words to the effect that the Company or management expects a stated condition or result to occur. Forward-looking information may be identified by such terms as ‘believes’, ‘anticipates’, ‘expects’, ‘estimates’, ‘may’, ‘could’, ‘would’, ‘will’, or ‘plan’. Forward-looking information contained in this news release include, but are not limited to, statements or information with respect to: the results of the PEA, including the IRR and NPV, life of mine and production, capital and operating expenditures, cost estimates; permitting restrictions, and the mine plan, including infrastructure requirements and future plans; the filing of the PEA, including timing thereof, mineral resources; and future gold prices. Since forward-looking information are based on assumptions and address future events and conditions, by their very nature they involve inherent risks and uncertainties as described in the Company’s filings with Canadian securities regulators. Assumptions upon which forward-looking information contained in this news release is based, without limitation, include: results of future exploration; gold prices; accuracy of the results of the PEA, including key assumptions and methods used to determine mineral resources and the results of the PEA; the ability to obtain required permits and approvals; the ability to execute future plans; exchange rates; ability to obtain funding; and changes in regulatory or community environment; Risks, and uncertainties include: results of further exploration; risks related to mineral tenure, permits and approvals; risks related to the execution of future plans; changes in gold price and exchange rates; risks related to obtaining financing; foreign country risks; regulatory risks and liabilities; and those risks and uncertainties as further described in the Company’s filings with Canadian securities regulators which can be found on SEDAR+ at www.sedarplus.ca under the Company’s profile. There can be no assurance that such information will prove to be accurate, as actual results and future events could differ materially from those anticipated in such information. Accordingly, readers should not place undue reliance on forward-looking information. The Company disclaims any intention or obligation to update or revise any forward-looking information, whether as a result of new information, future events or otherwise, other than as required by law.

    Dr. D.R. Webb, Ph.D., P.Geo., P.Eng. is the Q.P. responsible for this release within the meaning of NI 43-101 and has reviewed the technical content of this release and has approved its content.

    ON BEHALF OF THE BOARD OF DIRECTORS

    Ian Klassen, President
    For further information please contact:
    GMV Minerals Inc.
    Ian Klassen
    Tel: (604) 899-0106
    Email: info@gmvminerals.com

    Neither TSX Venture Exchange nor its Regulation Services Provider (as that term is defined in the policies of the TSX Venture Exchange) accepts responsibility for the adequacy or accuracy of this release.

    Source

    Click here to connect with GMV Minerals Inc. (TSXV:GMV)(OTCQB:GMVMF) to receive an Investor Presentation

    This post appeared first on investingnews.com

    Here are some charts that reflect our areas of focus this week at


    XLU Leads with New High

    Even though the Utilities SPDR (XLU) cannot keep pace with the Technology SPDR (XLK) and Communication Services SPDR (XLC), it is in a leading uptrend. XLU formed a cup-with-handle from November to July and broke to new highs the last two weeks. ETFs hitting new highs are in strong uptrends and should be on our radar.


    Metal Mania in 2025

    In a tribute to Ozzy, metals are leading the way higher in 2025. The PerfChart below shows year-to-date performance for the continuous futures for 12 commodities. Copper, Platinum and Palladium are up more than 45% year-to-date, while Gold is up 28.38% and Silver is up 35.30%. QQQ is up 10.52% year-to-date, but lagging these metals. The other commodities are mixed.


    Multi-Year Highs for Silver and Copper

    The next chart shows 11 year bar charts for five metals. Gold broke out in early 2024 and led the metals move with an advance the last 21 months. Silver and copper broke out to multi-year highs. Platinum broke above its 2021 high and Palladium got in the action with an 18 month high. There is a clear message here: metals are moving higher and leading as a group.  


    Home Construction Hits Moment of Truth

    The Home Construction ETF (ITB) hit its moment of truth as it rose to its falling 40-week SMA. Notice that ITB failed just below this moving average in August 2023. During the 2023-2024 uptrend, the 40-week SMA was more friendly as ITB reversed near this level in October 2023 and June 2024. ITB surged to the falling 40-week SMA in July, but the long-term trend is down and this area could be its nemesis.

    Thanks for Tuning in!

    See TrendInvestorPro.com for more


    The S&P 500 ($SPX) just logged its fifth straight trading box breakout, which means that, of the five trading ranges the index has experienced since the April lows, all have been resolved to the upside.

    How much longer can this last? That’s been the biggest question since the massive April 9 rally. Instead of assuming the market is due to roll over, it’s been more productive to track price action and watch for potential changes along the way. So far, drawdowns have been minimal, and breakouts keep occurring. Nothing in the price action hints at a lasting change — yet.

    While some are calling this rally “historic,” we have a recent precedent. Recall that from late 2023 through early 2024, the index had a strong start and gave way to a consistent, steady trend.

    From late October 2023 through March 2024, the S&P 500 logged seven consecutive trading box breakouts. That streak finally paused with a pullback from late March to early April, which, as we now know, was only a temporary hiccup. Once the bid returned, the S&P 500 went right back to carving new boxes and climbing higher.

    New 52-Week Highs Finally Picking Up

    If there’s been one gripe about this rally, it’s that the number of new highs within the index has lagged. As we’ve discussed before, among all the internal breadth indicators available, new highs almost always lag — that’s normal. What we really want to see is whether the number of new highs begins to exceed prior peaks as the market continues to rise, which it has, as shown by the blue line in the chart below.

    As of Wednesday’s close, 100 S&P 500 stocks were either at new 52-week highs or within 3% of them. That’s a strong base. We expect this number to continue rising as the market climbs, especially if positive earnings reactions persist across sectors.

    Even when we get that first day with 100+ S&P 500 stocks making new 52-week highs, though, it might not be the best time to initiate new longs.

    The above chart shows that much needs to align for that many stocks to peak in unison, which has historically led to at least a short-term consolidation, if not deeper pullbacks — as highlighted in yellow. Every time is different, of course, but this is something to keep an eye on in the coming weeks.

    Trend Check: GoNoGo Still “Go”

    The GoNoGo Trend remains in bullish mode, with the recent countertrend signals having yet to trigger a greater pullback.

    Active Bullish Patterns

    We still have two live bullish upside targets of 6,555 and 6,745, which could be with us for a while going forward. For the S&P 500 to get there, it will need to form new, smaller versions of the trading boxes.

    Failed Bearish Patterns

    In the chart below, you can view a rising wedge pattern on the recent price action, the third since April. The prior two wedges broke down briefly and did not lead to a major downturn. The largest pullbacks in each case occurred after the S&P 500 dipped below the lower trendline of the pattern.

    The deepest drawdown so far is 3.5%, which is not exactly a game-changer. Without downside follow-through, a classic bearish pattern simply can’t be formed, let alone be broken down from.

    We’ll continue to monitor these formations as they develop because, at some point, that will change.

    The price of zinc was on the rise in 2024, but this year has been a different story. The metal’s value has trended down for most of 2025 on the back of increased supply and weakening demand.

    Many base metals have taken hit from lagging demand in recent years due to sticky inflation and higher interest rates, and zinc is no exception. Zinc supply has also faced pressure from higher mining and refining costs, causing some major zinc mines and smelters to suspend operations, with more possible if the current economic situation continues.

    With its important role in the steel manufacturing process, the zinc market is heavily influenced by international trade. One area of support in the last few months has been turmoil caused by the US-China trade war and tariff threats .

    Data was gathered on July 30, 2025, using TradingView’s stock screener, and only zinc stocks with market caps greater than C$50 million at that time were considered. Read on to learn more about their operations and plans.

    1. Teck Resources (TSX:TECK.A,TSX:TECK.B)

    Market cap: C$22.01 billion
    Share price: C$45.04

    Teck Resources is a major global polymetallic miner, as well as one of the world’s top zinc producers.

    The Vancouver-headquartered company produced 615,900 metric tons (MT) of zinc in concentrate in 2024, with 555,600 MT coming from its Red Dog zinc mine in Alaska. The remaining 60,300 MT came from Teck’s 22.5 percent share of zinc production from the Peru-based Antamina copper-zinc mine.

    Teck’s total 2025 production guidance for the base metal is set in a range of 525,000 to 575,000 MT. As of June 30, the company’s zinc production for the year totaled 384,000 MT.

    In addition to the sites mentioned, Teck owns the Trail operations, which it describes as ‘one of the world’s largest fully integrated zinc and lead smelting and refining complexes.’ Located in BC, Canada, the Trail operations produced 256,000 MT of refined zinc in 2024, with 190,000 to 230,000 MT of the material expected in 2025.

    Teck pays a quarterly dividend. On September 29, it will pay out a dividend of C$0.125 per share.

    2. Fireweed Metals (TSXV:FWZ)

    Market cap: C$485.11 million
    Share price: C$2.32

    Fireweed Metals is a critical metals company whose flagship Macmillan Pass zinc project is located in Canada’s Yukon. In 2023, the company acquired the Gayna River zinc project in the Northwest Territories, as well as the Mactung tungsten project, which is adjacent to Macmillan Pass and straddles the border between Yukon and the Northwest Territories. According to Fireweed, Mactung ‘hosts the world’s largest high-grade tungsten deposit.’

    Even with these new assets, the company still has a strong focus on Macmillan Pass. In fact, in November 2023, the Fireweed team, led by Dr. Jack Milton, the firm’s vice president of geology, received the Association for Mineral Exploration’s H.H. “Spud” Huestis Award for its work at the Macmillan Pass property.

    Fireweed’s best drill intersection to date from Macmillan Pass’ Boundary zone includes 143.95 meters true width at 14.45 percent zinc, including 28.71 meters at 25.52 percent zinc. In September 2024, after its largest regional exploration campaign ever at Macmillan Pass, the company released an updated resource estimate for the Tom and Jason deposits, as well as inaugural resource estimates for the Boundary zone and End zone deposits.

    Fireweed launched its 2025 field program in early June, saying it will include 12,000 meters of diamond drilling at Macmillan Pass. The work will target ‘both high-priority regional prospects and step-outs around known zinc-lead-silver-gallium-germanium deposits,’ according to a press release.

    3. Trilogy Metals (TSX:TMQ)

    Market cap: C$405.68 million
    Share price: C$2.47

    Trilogy Metals is focused primarily on copper, zinc and cobalt at its Alaskan Upper Kobuk projects, which are held by Ambler Metals, a joint venture operating company owned equally by Trilogy and South32 (ASX:S32,OTC Pink:SHTLF).

    Its most advanced zinc project is the Arctic copper-zinc-lead-gold-silver volcanogenic massive sulfide project, which is in the feasibility stage and has proven and probable reserves of 43.44 million MT grading 3.12 percent zinc.

    In addition, early stage 2023 field work at the company’s wholly owned Helpmejack project in Alaska’s Ambler schist belt outlined two target areas prospective for volcanogenic massive sulfide and shale-hosted zinc deposits.

    Trilogy had been focusing on improving access to the region with its Amber Access project, but it was rejected by the US Bureau of Land Management under the Biden administration in June 2024 due to the impact the proposed road could have on the environment and communities in the region, which have seen little development.

    However, under the Trump administration, a series of executive and secretarial orders focusing on developing Alaska’s natural resources have been enacted that could reverse this decision.

    “Recent actions taken by President Donald Trump and Interior Secretary Doug Burgum signal a positive path forward for the Ambler Road,’ Trilogy Metals President and CEO Tony Giardini said. ‘This transportation corridor is crucial not only for providing access to the minerals that are vital to U.S. national security and prosperity, but also for much-needed economic growth and job creation in Alaska. Trilogy Metals is committed to working with all stakeholders on progressing the road, to unlock the vast natural resource potential of the Ambler Mining District.”

    4. Emerita Resources (TSXV:EMO)

    Market cap: C$317.02 million
    Share price: C$1.20

    Emerita Resources has a portfolio of high-grade, large-scale polymetallic projects covering more than 26,000 combined hectares in Spain’s Iberian Pyrite Belt. The company’s flagship asset is the Iberian Belt West project, which hosts three massive sulfide deposits: La Infanta, La Romanera and El Cura.

    Emerita released a resource estimate for Iberian Belt West in May 2023. It finished environmental baseline studies the following month, and completed supporting documentation for its mining license application in December 2023.

    In July 2024, the Andalusian government granted Iberian Belt West a declaration of strategic interest, which will streamline the process of moving the project through development.

    Phase 2 metallurgical testing results for the La Romanera and La Infanta deposits released in late 2024 show that commercial-grade copper, lead and zinc concentrates can be obtained from both deposits.

    In March of this year, Emerita announced an updated resource estimate for Iberian Belt West, showing a 35 percent increase to the total indicated mineral resource tonnage and a 44 percent increase in total inferred mineral resource tonnage. Also this year, Emerita made the cut for the latest TSX Venture 50 list.

    Securities Disclosure: I, Melissa Pistilli, hold no direct investment interest in any company mentioned in this article.

    This post appeared first on investingnews.com