Author

admin

Browsing

Markets don’t usually hit record highs, risk falling into bearish territory, and spring back to new highs within six months. But that’s what happened in 2025.

In this special mid-year recap, Grayson Roze sits down with David Keller, CMT, to show how disciplined routines, price-based signals, and a calm process helped them ride the whipsaw instead of getting tossed by it. You’ll see what really happened under the surface, how investor psychology drove the swings, and the exact StockCharts tools they leaned on to stay objective. 

If you’re focused on protecting capital, generating income, and sleeping well at night while still capturing the upside, this is a must-watch. Discover which charts deserve your attention now, what to ignore, and how to prep for the back half of 2025. 

This video premiered on July 23, 2025. Click on the above image to watch on our dedicated Grayson Roze page on StockCharts TV.

You can view previously recorded videos from Grayson at this link.

Here are some charts that reflect our areas of focus this week at


XLU Leads with New High

Even though the Utilities SPDR (XLU) cannot keep pace with the Technology SPDR (XLK) and Communication Services SPDR (XLC), it is in a leading uptrend. XLU formed a cup-with-handle from November to July and broke to new highs the last two weeks. ETFs hitting new highs are in strong uptrends and should be on our radar.


Metal Mania in 2025

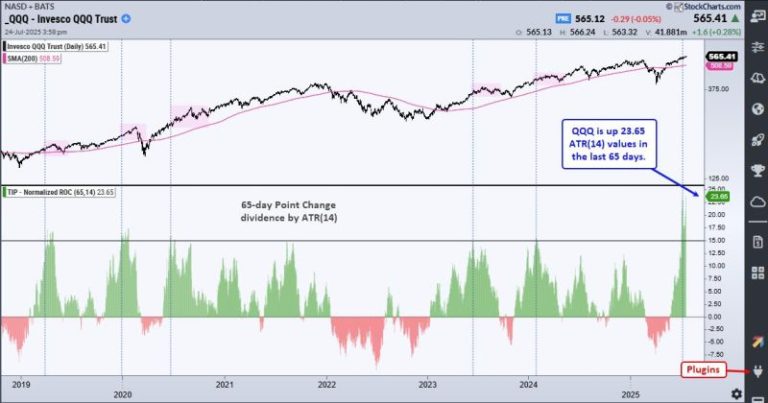
In a tribute to Ozzy, metals are leading the way higher in 2025. The PerfChart below shows year-to-date performance for the continuous futures for 12 commodities. Copper, Platinum and Palladium are up more than 45% year-to-date, while Gold is up 28.38% and Silver is up 35.30%. QQQ is up 10.52% year-to-date, but lagging these metals. The other commodities are mixed.


Multi-Year Highs for Silver and Copper

The next chart shows 11 year bar charts for five metals. Gold broke out in early 2024 and led the metals move with an advance the last 21 months. Silver and copper broke out to multi-year highs. Platinum broke above its 2021 high and Palladium got in the action with an 18 month high. There is a clear message here: metals are moving higher and leading as a group.  


Home Construction Hits Moment of Truth

The Home Construction ETF (ITB) hit its moment of truth as it rose to its falling 40-week SMA. Notice that ITB failed just below this moving average in August 2023. During the 2023-2024 uptrend, the 40-week SMA was more friendly as ITB reversed near this level in October 2023 and June 2024. ITB surged to the falling 40-week SMA in July, but the long-term trend is down and this area could be its nemesis.

Thanks for Tuning in!

See TrendInvestorPro.com for more


The S&P 500 ($SPX) just logged its fifth straight trading box breakout, which means that, of the five trading ranges the index has experienced since the April lows, all have been resolved to the upside.

How much longer can this last? That’s been the biggest question since the massive April 9 rally. Instead of assuming the market is due to roll over, it’s been more productive to track price action and watch for potential changes along the way. So far, drawdowns have been minimal, and breakouts keep occurring. Nothing in the price action hints at a lasting change — yet.

While some are calling this rally “historic,” we have a recent precedent. Recall that from late 2023 through early 2024, the index had a strong start and gave way to a consistent, steady trend.

From late October 2023 through March 2024, the S&P 500 logged seven consecutive trading box breakouts. That streak finally paused with a pullback from late March to early April, which, as we now know, was only a temporary hiccup. Once the bid returned, the S&P 500 went right back to carving new boxes and climbing higher.

New 52-Week Highs Finally Picking Up

If there’s been one gripe about this rally, it’s that the number of new highs within the index has lagged. As we’ve discussed before, among all the internal breadth indicators available, new highs almost always lag — that’s normal. What we really want to see is whether the number of new highs begins to exceed prior peaks as the market continues to rise, which it has, as shown by the blue line in the chart below.

As of Wednesday’s close, 100 S&P 500 stocks were either at new 52-week highs or within 3% of them. That’s a strong base. We expect this number to continue rising as the market climbs, especially if positive earnings reactions persist across sectors.

Even when we get that first day with 100+ S&P 500 stocks making new 52-week highs, though, it might not be the best time to initiate new longs.

The above chart shows that much needs to align for that many stocks to peak in unison, which has historically led to at least a short-term consolidation, if not deeper pullbacks — as highlighted in yellow. Every time is different, of course, but this is something to keep an eye on in the coming weeks.

Trend Check: GoNoGo Still “Go”

The GoNoGo Trend remains in bullish mode, with the recent countertrend signals having yet to trigger a greater pullback.

Active Bullish Patterns

We still have two live bullish upside targets of 6,555 and 6,745, which could be with us for a while going forward. For the S&P 500 to get there, it will need to form new, smaller versions of the trading boxes.

Failed Bearish Patterns

In the chart below, you can view a rising wedge pattern on the recent price action, the third since April. The prior two wedges broke down briefly and did not lead to a major downturn. The largest pullbacks in each case occurred after the S&P 500 dipped below the lower trendline of the pattern.

The deepest drawdown so far is 3.5%, which is not exactly a game-changer. Without downside follow-through, a classic bearish pattern simply can’t be formed, let alone be broken down from.

We’ll continue to monitor these formations as they develop because, at some point, that will change.

Is the market’s next surge already underway? Find out with Tom Bowley’s breakdown of where the money is flowing now and how you can get in front of it.

In this video, Tom covers key moves in the major indexes, revealing strength in transports, small caps, and home construction. He identifies industry rotation signals, which are pointing to aluminum, recreational products, and furnishings. Tom then demonstrates how to use StockCharts’ tools to scan for momentum stocks in emerging leadership groups — see why SGI tops Tom’s list. He ends with a discussion of post-earnings reactions from major names like GOOGL, TSLA, IBM, and LVS. 

And, of course, Tom wraps every idea with clear chart setups you can act on today. 

This video premiered on July 24, 2025. Click this link to watch on Tom’s dedicated page.

Missed a session? Archived videos from Tom are available at this link.

The newly formed media corporation Paramount Skydance has acquired The Free Press, an online news and commentary outlet co-founded by Bari Weiss, who will join CBS News as editor-in-chief.

Weiss launched The Free Press in 2021 with her wife, Nellie Bowles, and her sister, Suzy Weiss. They have presented the publication as a heterodox alternative to the legacy news media and a bulwark against “ideological narratives,” particularly on the political left.

Bari Weiss in New York in 2024.Noam Galai / Getty Images for The Free Press file

The acquisition is one of Skydance chief David Ellison’s most significant early moves to reshape the news unit at Paramount, which he acquired in a blockbuster $8 billion deal earlier this year.

In seeking federal approval of the merger, Skydance vowed to embrace “diverse viewpoints” and represent “the varied ideological perspectives of American viewers.” The company also pledged to install an ombudsman at the nearly 100-year-old CBS News operation.

“This partnership allows our ethos of fearless, independent journalism to reach an enormous, diverse, and influential audience,” Weiss said in a news release. “We honor the extraordinary legacy of CBS News by committing ourselves to a singular mission: building the most trusted news organization of the 21st Century.”

The Free Press has roughly 1.5 million subscribers on Substack, with more than 170,000 of them paid, according to Paramount Skydance. The Financial Times estimated that the publication generates more than $15 million in annual subscription revenue. NBC News has not independently verified that figure.

“Bari is a proven champion of independent, principled journalism, and I am confident her entrepreneurial drive and editorial vision will invigorate CBS News,” Ellison said in a statement. “This move is part of Paramount’s bigger vision to modernize content and the way it connects — directly and passionately — to audiences around the world.”

The acquisition talks between Ellison and Weiss were first reported in late June by Status, a media industry newsletter. Ellison is the son of billionaire tech mogul Larry Ellison, the co-founder of the software firm Oracle.

Weiss co-founded The Free Press after quitting the opinion section of The New York Times. In a resignation letter that was published online, Weiss decried what she characterized as the “illiberal environment” at the newspaper.

The Free Press earned wide attention in April 2024 after it published an essay from Uri Berliner, a senior business editor at National Public Radio who accused his employer of organizing around a “progressive worldview.” Berliner then resigned from NPR and joined The Free Press.

The publication’s regular stable of columnists includes Tyler Cowen, an economist and podcaster; Matthew Continetti, the author of a book about the evolution of American conservatism; and Niall Ferguson, a British-American historian.

CBS News has repeatedly found itself in the national spotlight in recent months. President Donald Trump filed a lawsuit last year against Paramount accusing “60 Minutes” of deceptively editing an interview with then-Vice President Kamala Harris.

CBS denied the claim. Paramount settled Trump’s lawsuit for $16 million.

The Federal Communications Commission is still investigating whether CBS engaged in “news distortion.” The commission is chaired by Brendan Carr, who was appointed by Trump at the start of his second term.

This post appeared first on NBC NEWS

Charlie Javice, the founder of a startup company that sought to dramatically improve how students apply for financial aid, was sentenced Monday to more than seven years in prison for cheating JPMorgan Chase out of $175 million by greatly exaggerating how many students it served.

Javice, 33, was sentenced in Manhattan federal court for her March conviction by Judge Alvin K. Hellerstein, who said she committed “a large fraud” by duping the bank giant in the summer of 2021. She made false records that made it seem the company, called Frank, had over 4 million customers when it had fewer than 300,000, Hellerstein found.

The judge said Javice had assembled a “very powerful list” of her charitable acts, which included organizing soup kitchens for the homeless when she was 7 years old and designing career programs for formerly incarcerated women.

In court papers, defense lawyers noted that Javice has faced extraordinary public scrutiny, reputational destruction and professional exile, “making her a household name” in the same way Elizabeth Holmes became synonymous with her blood-testing company, Theranos.

Defense attorney Ronald Sullivan told Hellerstein that his client was very different from Holmes because what she created actually worked, unlike Holmes, “who did not have a real company” and whose product “in fact endangered patients.”

In seeking a 12-year prison sentence for Javice, prosecutors cited a 2022 text Javice sent to a colleague in which she called it “ridiculous” that Holmes got over 11 years in prison.

Hellerstein largely dismissed arguments that he should be lenient because the acquisition pitted “a 28-year-old versus 300 investment bankers from the largest bank in the world,” as Sullivan put it.

Still, the judge criticized the bank, saying “they have a lot to blame themselves” after failing to do adequate due diligence. He quickly added, though, that he was “punishing her conduct and not JPMorgan’s stupidity.”

Sullivan said the bank rushed its negotiations because it feared another bank would acquire Frank first.

A prosecutor, Micah Fergenson, though, said JPMorgan “didn’t get a functioning business” in exchange for its investment. “They acquired a crime scene.”

Fergenson said Javice was driven by greed when she saw that she could pocket $29 million from the sale of her company.

“Ms. Javice had it dangling in front of her and she lied to get it,” he said.

Given a chance to speak, Javice said she was “haunted that my failure has transformed something meaningful into something infamous.” She said she “made a choice that I will spend my entire life regretting.”

Javice, sometimes speaking through tears, apologized and sought forgiveness from “all the people touched or tarnished by my actions,” including JPMorgan shareholders, Frank employees and investors, along with her family.

Javice, who lives in Florida, has been free on $2 million bail since her 2023 arrest.

At trial, Javice, a graduate of the University of Pennsylvania’s Wharton School of Business, was convicted of conspiracy, bank fraud and wire fraud charges. Her lawyers had argued that JPMorgan went after Javice because it had buyer’s remorse.

In her mid-20s, Javice founded Frank, a company with software that promised to simplify the arduous process of filling out the Free Application for Federal Student Aid, a complex government form used by students to apply for aid for college or graduate school.

Frank’s backers included venture capitalist Michael Eisenberg. The company said its offering, akin to online tax preparation software, could help students maximize financial aid while making the application process less painful.

The company promoted itself as a way for financially needy students to obtain more aid faster, in return for a few hundred dollars in fees. Javice appeared regularly on cable news programs to boost Frank’s profile, once appearing on Forbes’ “30 Under 30” list before JPMorgan bought the startup in 2021.

Javice was among a number of young tech executives who vaulted to fame with supposedly disruptive or transformative companies, only to see them collapse amid questions about whether they had engaged in puffery and fraud while dealing with investors.

In their pre-sentence submission, prosecutors wrote that they were requesting a lengthy prison sentence to send a message that fraud in the sale of startup companies is “no less blameworthy than other types of fraud and will be punished accordingly.”

Prosecutors added that the message was “desperately needed” because of “an alarming trend of founders and executives of small startup companies engaging in fraud, including making misrepresentations about their companies’ core products or services, in order to make their companies attractive targets for investors and/or buyers.”

This post appeared first on NBC NEWS

Markets don’t usually hit record highs, risk falling into bearish territory, and spring back to new highs within six months. But that’s what happened in 2025.

In this special mid-year recap, Grayson Roze sits down with David Keller, CMT, to show how disciplined routines, price-based signals, and a calm process helped them ride the whipsaw instead of getting tossed by it. You’ll see what really happened under the surface, how investor psychology drove the swings, and the exact StockCharts tools they leaned on to stay objective. 

If you’re focused on protecting capital, generating income, and sleeping well at night while still capturing the upside, this is a must-watch. Discover which charts deserve your attention now, what to ignore, and how to prep for the back half of 2025. 

This video premiered on July 23, 2025. Click on the above image to watch on our dedicated Grayson Roze page on StockCharts TV.

You can view previously recorded videos from Grayson at this link.

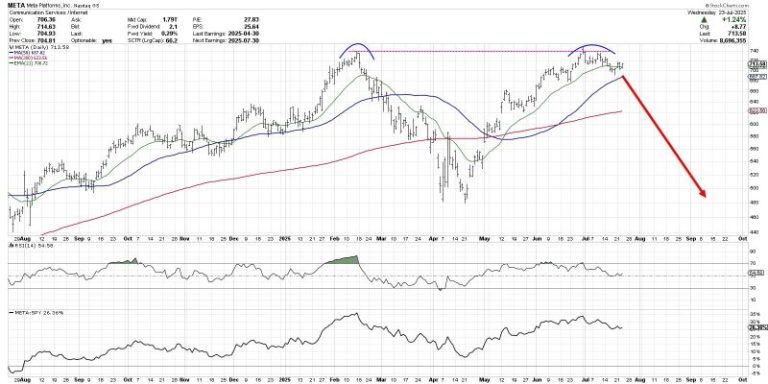
The chart of Meta Platforms, Inc. (META) has completed a roundtrip from the February high around $740 to the April low at $480 and all the way back again.  Over the last couple weeks, META has now pulled back from its retest of all-time highs, leaving investors to wonder what may come next.

Is this the beginning of a new downtrend phase for META?  Or just a brief pullback before a new uptrend phase propels META to new all-time highs?

Today we’ll look at two potential scenarios, including the double top pattern and the cup and handle pattern, and share which technical indicators and approaches could help us determine which path plays out into August.

The double top scenario basically means that the late July retest of the previous all-time high was the end of the recent uptrend phase.  The double top pattern is literally when a major resistance level is set and then retested.  The implication is that a lack of willing buyers means the uptrend is exhausted, and there is nowhere to go but down.

While the 21-day exponential moving average is currently in play for META, I would say that a break below the 50-day moving average could confirm this as the correct scenario.  If that smoothing mechanism does not hold, then the price action would imply less of a pullback and more like the beginning of a real distribution phase.

What is META pulls back but then resumes an uptrend phase, leading META to another new all-time high?  That would result in a confirmed cup and handle pattern, created by a large rounded bottoming pattern followed by a brief pullback.  The key to this pattern is the “rim” of the cup, which sits right at $740 for META.

Given the pullback META has demonstrated so far in July, I would say that a break above the $740 level would basically confirm a bullish cup and handle pattern.  That would suggest much more upside potential for META, as the stock would literally go into previously uncharted territory.

So how can we determine which scenario is more likely to play out?  This is where we need to incorporate more technical indicators into the discussion, as a way to further validate and confirm our investment thesis.

Just to review, I think a break above $740 would confirm a bullish cup and handle pattern.  I would also say that a break below the $680 level, which would represent a move below the 50-day moving average as well as the June swing lows, would basically confirm a bearish double top pattern.

We can also use the Relative Strength Index (RSI) to help determine whether META remains in a bullish trend phase.  During bull phases, the RSI rarely gets below 40, because buyers usually step in to “buy the dips” and keep the momentum fairly constructive.  So if the price would break down, and the RSI would not hold that crucial 40 level, that could mean a bearish outlook is warranted.

Finally, we can use volume-based indicators to assess whether moves in the price are supported by stronger volume readings.  Here I’ve included the Accumulation/Distribution Line, which tracks the trend in daily volume readings over time.  We can see that the high in July resulted in a divergence, as the A/D line was trending lower.  If the A/D line would break below its June and July lows, marked by a dashed red line, that would represent a bearish volume reading for META.

Technical analysis is less about predicting the future, and more about determining the most probable scenarios based on our analysis of trend, momentum, and volume.  I hope this discussion shows how the outlook for META can be easily determined and tracked using the best practices of technical analysis!

RR#6,

Dave

PS- Ready to upgrade your investment process?  Check out my free behavioral investing course!

David Keller, CMT

President and Chief Strategist

Sierra Alpha Research LLC

marketmisbehavior.com

https://www.youtube.com/c/MarketMisbehavior

Disclaimer: This blog is for educational purposes only and should not be construed as financial advice.  The ideas and strategies should never be used without first assessing your own personal and financial situation, or without consulting a financial professional.  

The author does not have a position in mentioned securities at the time of publication.    Any opinions expressed herein are solely those of the author and do not in any way represent the views or opinions of any other person or entity.

Is the market’s next surge already underway? Find out with Tom Bowley’s breakdown of where the money is flowing now and how you can get in front of it.

In this video, Tom covers key moves in the major indexes, revealing strength in transports, small caps, and home construction. He identifies industry rotation signals, which are pointing to aluminum, recreational products, and furnishings. Tom then demonstrates how to use StockCharts’ tools to scan for momentum stocks in emerging leadership groups — see why SGI tops Tom’s list. He ends with a discussion of post-earnings reactions from major names like GOOGL, TSLA, IBM, and LVS. 

And, of course, Tom wraps every idea with clear chart setups you can act on today. 

This video premiered on July 24, 2025. Click this link to watch on Tom’s dedicated page.

Missed a session? Archived videos from Tom are available at this link.

The S&P 500 ($SPX) just logged its fifth straight trading box breakout, which means that, of the five trading ranges the index has experienced since the April lows, all have been resolved to the upside.

How much longer can this last? That’s been the biggest question since the massive April 9 rally. Instead of assuming the market is due to roll over, it’s been more productive to track price action and watch for potential changes along the way. So far, drawdowns have been minimal, and breakouts keep occurring. Nothing in the price action hints at a lasting change — yet.

While some are calling this rally “historic,” we have a recent precedent. Recall that from late 2023 through early 2024, the index had a strong start and gave way to a consistent, steady trend.

From late October 2023 through March 2024, the S&P 500 logged seven consecutive trading box breakouts. That streak finally paused with a pullback from late March to early April, which, as we now know, was only a temporary hiccup. Once the bid returned, the S&P 500 went right back to carving new boxes and climbing higher.

New 52-Week Highs Finally Picking Up

If there’s been one gripe about this rally, it’s that the number of new highs within the index has lagged. As we’ve discussed before, among all the internal breadth indicators available, new highs almost always lag — that’s normal. What we really want to see is whether the number of new highs begins to exceed prior peaks as the market continues to rise, which it has, as shown by the blue line in the chart below.

As of Wednesday’s close, 100 S&P 500 stocks were either at new 52-week highs or within 3% of them. That’s a strong base. We expect this number to continue rising as the market climbs, especially if positive earnings reactions persist across sectors.

Even when we get that first day with 100+ S&P 500 stocks making new 52-week highs, though, it might not be the best time to initiate new longs.

The above chart shows that much needs to align for that many stocks to peak in unison, which has historically led to at least a short-term consolidation, if not deeper pullbacks — as highlighted in yellow. Every time is different, of course, but this is something to keep an eye on in the coming weeks.

Trend Check: GoNoGo Still “Go”

The GoNoGo Trend remains in bullish mode, with the recent countertrend signals having yet to trigger a greater pullback.

Active Bullish Patterns

We still have two live bullish upside targets of 6,555 and 6,745, which could be with us for a while going forward. For the S&P 500 to get there, it will need to form new, smaller versions of the trading boxes.

Failed Bearish Patterns

In the chart below, you can view a rising wedge pattern on the recent price action, the third since April. The prior two wedges broke down briefly and did not lead to a major downturn. The largest pullbacks in each case occurred after the S&P 500 dipped below the lower trendline of the pattern.

The deepest drawdown so far is 3.5%, which is not exactly a game-changer. Without downside follow-through, a classic bearish pattern simply can’t be formed, let alone be broken down from.

We’ll continue to monitor these formations as they develop because, at some point, that will change.