Author

admin

Browsing

Is the market’s next surge already underway? Find out with Tom Bowley’s breakdown of where the money is flowing now and how you can get in front of it.

In this video, Tom covers key moves in the major indexes, revealing strength in transports, small caps, and home construction. He identifies industry rotation signals, which are pointing to aluminum, recreational products, and furnishings. Tom then demonstrates how to use StockCharts’ tools to scan for momentum stocks in emerging leadership groups — see why SGI tops Tom’s list. He ends with a discussion of post-earnings reactions from major names like GOOGL, TSLA, IBM, and LVS. 

And, of course, Tom wraps every idea with clear chart setups you can act on today. 

This video premiered on July 24, 2025. Click this link to watch on Tom’s dedicated page.

Missed a session? Archived videos from Tom are available at this link.

YouTube said Monday it would settle a lawsuit brought by President Donald Trump for more than $24 million, adding to a growing list of settlements with tech and media companies that have amassed millions of dollars for Trump’s projects.

Trump sued after his YouTube account was banned in 2021. After the Jan. 6 riot, YouTube said content posted to Trump’s channel raised “concerns about the ongoing potential for violence.” His account was reinstated in 2023.

Monday’s settlement makes YouTube the last major tech platform to settle a lawsuit with Trump, who similarly sued Meta and Twitter for banning his accounts in the aftermath of Jan. 6. Meta, the owner of Facebook and Instagram, settled for $25 million, while Twitter, since renamed X, settled for about $10 million.

A notice of settlement for Trump’s lawsuit against YouTube details that $22 million of it will go toward building a new White House ballroom. Trump has touted that the addition will have room for 900 people, and the White House has said it could cost $200 million to build.

Other plaintiffs that joined Trump’s suit, such as the American Conservative Union and a number of other people, will get $2.5 million of the settlement.

In addition to tech companies, many major media outlets have settled lawsuits with Trump over the past year.

In July, Paramount Global settled with him for $16 million after he took issue with a “60 Minutes” interview with Kamala Harris that aired on CBS.

In December, Disney settled with Trump over a lawsuit in which he accused ABC and anchor George Stephanopoulos of defamation in an interview with Rep. Nancy Mace, R-S.C. Disney paid Trump’s future presidential library $15 million as part of the settlement.

Disney came under pressure from the administration again when it recently suspended “Jimmy Kimmel Live!” for nearly a week after two major station owners threatened to stop airing the show. One of the station owners, Nexstar, is seeking clearance from Trump’s Federal Communications Commission chairman for a $6.2 billion merger.

The other station owner, Sinclair, is reportedly considering a merger, which the FCC would also need to approve.

Trump is also suing The Wall Street Journal over its reporting about his friendship with Jeffrey Epstein, and he recently sued The New York Times for $15 billion. A judge struck down that lawsuit, though Trump could refile it.

This post appeared first on NBC NEWS

Markets don’t usually hit record highs, risk falling into bearish territory, and spring back to new highs within six months. But that’s what happened in 2025.

In this special mid-year recap, Grayson Roze sits down with David Keller, CMT, to show how disciplined routines, price-based signals, and a calm process helped them ride the whipsaw instead of getting tossed by it. You’ll see what really happened under the surface, how investor psychology drove the swings, and the exact StockCharts tools they leaned on to stay objective. 

If you’re focused on protecting capital, generating income, and sleeping well at night while still capturing the upside, this is a must-watch. Discover which charts deserve your attention now, what to ignore, and how to prep for the back half of 2025. 

This video premiered on July 23, 2025. Click on the above image to watch on our dedicated Grayson Roze page on StockCharts TV.

You can view previously recorded videos from Grayson at this link.

Is the market’s next surge already underway? Find out with Tom Bowley’s breakdown of where the money is flowing now and how you can get in front of it.

In this video, Tom covers key moves in the major indexes, revealing strength in transports, small caps, and home construction. He identifies industry rotation signals, which are pointing to aluminum, recreational products, and furnishings. Tom then demonstrates how to use StockCharts’ tools to scan for momentum stocks in emerging leadership groups — see why SGI tops Tom’s list. He ends with a discussion of post-earnings reactions from major names like GOOGL, TSLA, IBM, and LVS. 

And, of course, Tom wraps every idea with clear chart setups you can act on today. 

This video premiered on July 24, 2025. Click this link to watch on Tom’s dedicated page.

Missed a session? Archived videos from Tom are available at this link.

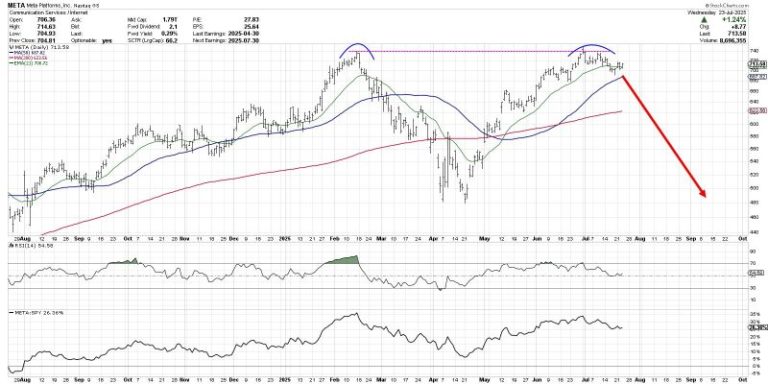
The chart of Meta Platforms, Inc. (META) has completed a roundtrip from the February high around $740 to the April low at $480 and all the way back again.  Over the last couple weeks, META has now pulled back from its retest of all-time highs, leaving investors to wonder what may come next.

Is this the beginning of a new downtrend phase for META?  Or just a brief pullback before a new uptrend phase propels META to new all-time highs?

Today we’ll look at two potential scenarios, including the double top pattern and the cup and handle pattern, and share which technical indicators and approaches could help us determine which path plays out into August.

The double top scenario basically means that the late July retest of the previous all-time high was the end of the recent uptrend phase.  The double top pattern is literally when a major resistance level is set and then retested.  The implication is that a lack of willing buyers means the uptrend is exhausted, and there is nowhere to go but down.

While the 21-day exponential moving average is currently in play for META, I would say that a break below the 50-day moving average could confirm this as the correct scenario.  If that smoothing mechanism does not hold, then the price action would imply less of a pullback and more like the beginning of a real distribution phase.

What is META pulls back but then resumes an uptrend phase, leading META to another new all-time high?  That would result in a confirmed cup and handle pattern, created by a large rounded bottoming pattern followed by a brief pullback.  The key to this pattern is the “rim” of the cup, which sits right at $740 for META.

Given the pullback META has demonstrated so far in July, I would say that a break above the $740 level would basically confirm a bullish cup and handle pattern.  That would suggest much more upside potential for META, as the stock would literally go into previously uncharted territory.

So how can we determine which scenario is more likely to play out?  This is where we need to incorporate more technical indicators into the discussion, as a way to further validate and confirm our investment thesis.

Just to review, I think a break above $740 would confirm a bullish cup and handle pattern.  I would also say that a break below the $680 level, which would represent a move below the 50-day moving average as well as the June swing lows, would basically confirm a bearish double top pattern.

We can also use the Relative Strength Index (RSI) to help determine whether META remains in a bullish trend phase.  During bull phases, the RSI rarely gets below 40, because buyers usually step in to “buy the dips” and keep the momentum fairly constructive.  So if the price would break down, and the RSI would not hold that crucial 40 level, that could mean a bearish outlook is warranted.

Finally, we can use volume-based indicators to assess whether moves in the price are supported by stronger volume readings.  Here I’ve included the Accumulation/Distribution Line, which tracks the trend in daily volume readings over time.  We can see that the high in July resulted in a divergence, as the A/D line was trending lower.  If the A/D line would break below its June and July lows, marked by a dashed red line, that would represent a bearish volume reading for META.

Technical analysis is less about predicting the future, and more about determining the most probable scenarios based on our analysis of trend, momentum, and volume.  I hope this discussion shows how the outlook for META can be easily determined and tracked using the best practices of technical analysis!

RR#6,

Dave

PS- Ready to upgrade your investment process?  Check out my free behavioral investing course!

David Keller, CMT

President and Chief Strategist

Sierra Alpha Research LLC

marketmisbehavior.com

https://www.youtube.com/c/MarketMisbehavior

Disclaimer: This blog is for educational purposes only and should not be construed as financial advice.  The ideas and strategies should never be used without first assessing your own personal and financial situation, or without consulting a financial professional.  

The author does not have a position in mentioned securities at the time of publication.    Any opinions expressed herein are solely those of the author and do not in any way represent the views or opinions of any other person or entity.

The S&P 500 ($SPX) just logged its fifth straight trading box breakout, which means that, of the five trading ranges the index has experienced since the April lows, all have been resolved to the upside.

How much longer can this last? That’s been the biggest question since the massive April 9 rally. Instead of assuming the market is due to roll over, it’s been more productive to track price action and watch for potential changes along the way. So far, drawdowns have been minimal, and breakouts keep occurring. Nothing in the price action hints at a lasting change — yet.

While some are calling this rally “historic,” we have a recent precedent. Recall that from late 2023 through early 2024, the index had a strong start and gave way to a consistent, steady trend.

From late October 2023 through March 2024, the S&P 500 logged seven consecutive trading box breakouts. That streak finally paused with a pullback from late March to early April, which, as we now know, was only a temporary hiccup. Once the bid returned, the S&P 500 went right back to carving new boxes and climbing higher.

New 52-Week Highs Finally Picking Up

If there’s been one gripe about this rally, it’s that the number of new highs within the index has lagged. As we’ve discussed before, among all the internal breadth indicators available, new highs almost always lag — that’s normal. What we really want to see is whether the number of new highs begins to exceed prior peaks as the market continues to rise, which it has, as shown by the blue line in the chart below.

As of Wednesday’s close, 100 S&P 500 stocks were either at new 52-week highs or within 3% of them. That’s a strong base. We expect this number to continue rising as the market climbs, especially if positive earnings reactions persist across sectors.

Even when we get that first day with 100+ S&P 500 stocks making new 52-week highs, though, it might not be the best time to initiate new longs.

The above chart shows that much needs to align for that many stocks to peak in unison, which has historically led to at least a short-term consolidation, if not deeper pullbacks — as highlighted in yellow. Every time is different, of course, but this is something to keep an eye on in the coming weeks.

Trend Check: GoNoGo Still “Go”

The GoNoGo Trend remains in bullish mode, with the recent countertrend signals having yet to trigger a greater pullback.

Active Bullish Patterns

We still have two live bullish upside targets of 6,555 and 6,745, which could be with us for a while going forward. For the S&P 500 to get there, it will need to form new, smaller versions of the trading boxes.

Failed Bearish Patterns

In the chart below, you can view a rising wedge pattern on the recent price action, the third since April. The prior two wedges broke down briefly and did not lead to a major downturn. The largest pullbacks in each case occurred after the S&P 500 dipped below the lower trendline of the pattern.

The deepest drawdown so far is 3.5%, which is not exactly a game-changer. Without downside follow-through, a classic bearish pattern simply can’t be formed, let alone be broken down from.

We’ll continue to monitor these formations as they develop because, at some point, that will change.

Here are some charts that reflect our areas of focus this week at


XLU Leads with New High

Even though the Utilities SPDR (XLU) cannot keep pace with the Technology SPDR (XLK) and Communication Services SPDR (XLC), it is in a leading uptrend. XLU formed a cup-with-handle from November to July and broke to new highs the last two weeks. ETFs hitting new highs are in strong uptrends and should be on our radar.


Metal Mania in 2025

In a tribute to Ozzy, metals are leading the way higher in 2025. The PerfChart below shows year-to-date performance for the continuous futures for 12 commodities. Copper, Platinum and Palladium are up more than 45% year-to-date, while Gold is up 28.38% and Silver is up 35.30%. QQQ is up 10.52% year-to-date, but lagging these metals. The other commodities are mixed.


Multi-Year Highs for Silver and Copper

The next chart shows 11 year bar charts for five metals. Gold broke out in early 2024 and led the metals move with an advance the last 21 months. Silver and copper broke out to multi-year highs. Platinum broke above its 2021 high and Palladium got in the action with an 18 month high. There is a clear message here: metals are moving higher and leading as a group.  


Home Construction Hits Moment of Truth

The Home Construction ETF (ITB) hit its moment of truth as it rose to its falling 40-week SMA. Notice that ITB failed just below this moving average in August 2023. During the 2023-2024 uptrend, the 40-week SMA was more friendly as ITB reversed near this level in October 2023 and June 2024. ITB surged to the falling 40-week SMA in July, but the long-term trend is down and this area could be its nemesis.

Thanks for Tuning in!

See TrendInvestorPro.com for more


President Donald Trump on Thursday announced a new round of punishing tariffs, saying the United States will impose a 100% tariff on imported branded drugs, 25% tariff on imports of all heavy-duty trucks and 50% tariffs on kitchen cabinets.

Trump also said he would start charging a 30% tariff on upholstered furniture next week.

He said the new heavy-duty truck tariffs were to protect manufacturers from “unfair outside competition” and said the move would benefit companies such as Paccar-owned PCAR.O Peterbilt and Kenworth and Daimler Truck-owned DTGGe.DE Freightliner.

Trump has launched numerous national security probes into potential new tariffs on a wide variety of products.

He said the new tariffs on kitchen, bathroom and some furniture were because of huge levels of imports that were hurting local manufacturers.

“The reason for this is the large-scale ‘FLOODING’ of these products into the United States by other outside Countries,” Trump said, citing national security concerns about U.S. manufacturing.

The U.S. Chamber of Commerce urged the department not to impose new tariffs, noting the top five import sources are Mexico, Canada, Japan, Germany and Finland “all of which are allies or close partners of the United States posing no threat to U.S. national security.”

Mexico is the largest exporter of medium- and heavy-duty trucks to the United States. A study released in January said imports of those larger vehicles from Mexico have tripled since 2019.

Higher tariffs on commercial vehicles could put pressure on transportation costs just as Trump has vowed to reduce inflation, especially on consumer goods such as groceries.

Tariffs could also affect Chrysler-parent Stellantis STLAM.MI, which produces heavy-duty Ram trucks and commercial vans in Mexico. Sweden’s Volvo Group VOLVb.ST is building a $700 million heavy-truck factory in Monterrey, Mexico, set to start operations in 2026.

Mexico is home to 14 manufacturers and assemblers of buses, trucks, and tractor trucks, and two manufacturers of engines, according to the U.S. International Trade Administration.

The country is also the leading global exporter of tractor trucks, 95% of which are destined for the United States.

“We need our Truckers to be financially healthy and strong, for many reasons, but above all else, for National Security purposes!” Trump added.

Mexico opposed new tariffs, telling the Commerce Department in May that all Mexican trucks exported to the United States have on average 50% U.S. content, including diesel engines.

Last year, the United States imported almost $128 billion in heavy vehicle parts from Mexico, accounting for approximately 28% of total U.S. imports, Mexico said.

The Japanese Automobile Manufacturers Association also opposed new tariffs, saying Japanese companies have cut exports to the United States as they have boosted U.S. production of medium- and heavy-duty trucks.

This post appeared first on NBC NEWS

Electronic Arts, maker of video games like “Madden NFL,” “Battlefield,” and “The Sims,” is being acquired for $52.5 billion in what could become the largest-ever buyout funded by private-equity firms.

The private equity firm Silver Lake Partners, Saudi Arabia’s sovereign wealth fund PIF, and Affinity Partners will pay EA’s stockholders $210 per share. Affinity Partners is run by President Donald Trump’s son-in-law, Jared Kushner.

PIF, which was already the largest insider stakeholder in Electronic Arts, will be rolling over its existing 9.9% stake in the company.

The commitment to the massive deal is inline with recent activity by Saudi Arabia’s sovereign wealth fund, wrote Andrew Marok of Raymond James.

“The Saudi PIF has been a very active player in the video gaming market since 2022, taking minority stakes in most scaled public video gaming publishers, and also outright purchases of companies like ESL, FACEIT, and Scopely,” he wrote. “The PIF has made its intentions to scale its gaming arm, Savvy Gaming Group, clear, and the EA deal would represent the biggest such move to date by some distance.”

Electronic Arts would be taken private and its headquarters will remain in Redwood City, California.

The total value of the deal eclipses the $32 billion price paid to take Texas utility TXU private in 2007.

If the transaction closes as anticipated, it will end EA’s 36-year history as a publicly traded company that began with its shares ending its first day of trading at a split-adjusted 52 cents.

The IPO came seven years after EA was founded by former Apple employee William “Trip” Hawkins, who began playing analog versions of baseball and football made by “Strat-O-Matic” as a teenager during the 1960s.

CEO Andrew Wilson has led the company since 2013 and he will remain in that role, the firms said Monday.

“Electronic Arts is an extraordinary company with a world-class management team and a bold vision for the future,” said Kushner, who serves as CEO of Affinity Partners. “I’ve admired their ability to create iconic, lasting experiences, and as someone who grew up playing their games — and now enjoys them with his kids — I couldn’t be more excited about what’s ahead.”

This marks the second high-profile deal involving Silver Lake and a technology company with a legion of loyal fans in recent weeks. Silver Lake is also part of a newly formed joint venture spearheaded by Oracle involved in a deal to take over the U.S. oversight of TikTok’s social video platform, although all the details of that complex transaction haven’t been divulged yet.

Silver Lake has also previously bought out two other well-known technology companies, the now-defunct video calling service Skype in a $1.9 billion deal completed in 2009, and a $24.9 billion buyout of personal computer maker Dell in 2013. After Dell restructured its operations as a private company, it returned to the stock market with publicly traded shares in 2018.

By going private, EA will be able to reprogram its operations without being subjected to the investment pressures and scrutiny that sometimes compel publicly held companies to make short-sighted decisions aimed at meeting quarterly financial targets. Although its video games still have a fervent following, EA’s annual revenues have been stagnant during the past three fiscal years, hovering from $7.4 billion to $7.6 billion.

Meanwhile, one of its biggest rivals Activision Blizzard was snapped up by technology powerhouse Microsoft for nearly $69 billion in 2023, while the competition from mobile video game makers such as Epic Games has intensified.

After being taken private, formerly public companies often undergo extensive cost-cutting that includes layoffs, although there has been no indication that will be the case with EA. After jettisoning about 5% of its workforce in 2024, EA ended March with 14,500 employees and then laid off several hundred people in May.

The deal is expected to close in the first quarter of 2027. It still needs approval from EA shareholders.

EA’s stock rose more than 5% before the opening bell.

This post appeared first on NBC NEWS

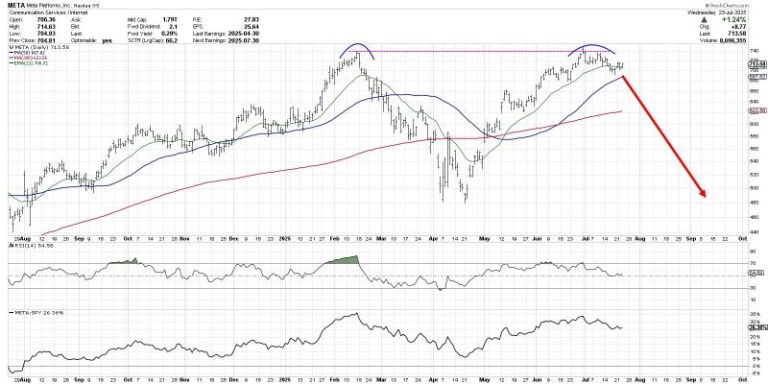
The chart of Meta Platforms, Inc. (META) has completed a roundtrip from the February high around $740 to the April low at $480 and all the way back again.  Over the last couple weeks, META has now pulled back from its retest of all-time highs, leaving investors to wonder what may come next.

Is this the beginning of a new downtrend phase for META?  Or just a brief pullback before a new uptrend phase propels META to new all-time highs?

Today we’ll look at two potential scenarios, including the double top pattern and the cup and handle pattern, and share which technical indicators and approaches could help us determine which path plays out into August.

The double top scenario basically means that the late July retest of the previous all-time high was the end of the recent uptrend phase.  The double top pattern is literally when a major resistance level is set and then retested.  The implication is that a lack of willing buyers means the uptrend is exhausted, and there is nowhere to go but down.

While the 21-day exponential moving average is currently in play for META, I would say that a break below the 50-day moving average could confirm this as the correct scenario.  If that smoothing mechanism does not hold, then the price action would imply less of a pullback and more like the beginning of a real distribution phase.

What is META pulls back but then resumes an uptrend phase, leading META to another new all-time high?  That would result in a confirmed cup and handle pattern, created by a large rounded bottoming pattern followed by a brief pullback.  The key to this pattern is the “rim” of the cup, which sits right at $740 for META.

Given the pullback META has demonstrated so far in July, I would say that a break above the $740 level would basically confirm a bullish cup and handle pattern.  That would suggest much more upside potential for META, as the stock would literally go into previously uncharted territory.

So how can we determine which scenario is more likely to play out?  This is where we need to incorporate more technical indicators into the discussion, as a way to further validate and confirm our investment thesis.

Just to review, I think a break above $740 would confirm a bullish cup and handle pattern.  I would also say that a break below the $680 level, which would represent a move below the 50-day moving average as well as the June swing lows, would basically confirm a bearish double top pattern.

We can also use the Relative Strength Index (RSI) to help determine whether META remains in a bullish trend phase.  During bull phases, the RSI rarely gets below 40, because buyers usually step in to “buy the dips” and keep the momentum fairly constructive.  So if the price would break down, and the RSI would not hold that crucial 40 level, that could mean a bearish outlook is warranted.

Finally, we can use volume-based indicators to assess whether moves in the price are supported by stronger volume readings.  Here I’ve included the Accumulation/Distribution Line, which tracks the trend in daily volume readings over time.  We can see that the high in July resulted in a divergence, as the A/D line was trending lower.  If the A/D line would break below its June and July lows, marked by a dashed red line, that would represent a bearish volume reading for META.

Technical analysis is less about predicting the future, and more about determining the most probable scenarios based on our analysis of trend, momentum, and volume.  I hope this discussion shows how the outlook for META can be easily determined and tracked using the best practices of technical analysis!

RR#6,

Dave

PS- Ready to upgrade your investment process?  Check out my free behavioral investing course!

David Keller, CMT

President and Chief Strategist

Sierra Alpha Research LLC

marketmisbehavior.com

https://www.youtube.com/c/MarketMisbehavior

Disclaimer: This blog is for educational purposes only and should not be construed as financial advice.  The ideas and strategies should never be used without first assessing your own personal and financial situation, or without consulting a financial professional.  

The author does not have a position in mentioned securities at the time of publication.    Any opinions expressed herein are solely those of the author and do not in any way represent the views or opinions of any other person or entity.