Author

admin

Browsing

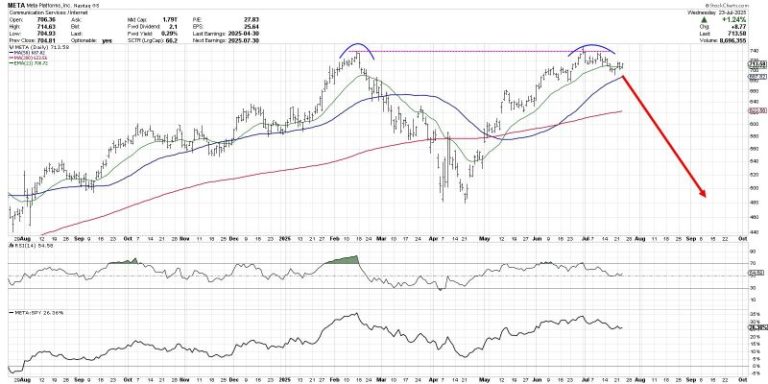
The chart of Meta Platforms, Inc. (META) has completed a roundtrip from the February high around $740 to the April low at $480 and all the way back again.  Over the last couple weeks, META has now pulled back from its retest of all-time highs, leaving investors to wonder what may come next.

Is this the beginning of a new downtrend phase for META?  Or just a brief pullback before a new uptrend phase propels META to new all-time highs?

Today we’ll look at two potential scenarios, including the double top pattern and the cup and handle pattern, and share which technical indicators and approaches could help us determine which path plays out into August.

The double top scenario basically means that the late July retest of the previous all-time high was the end of the recent uptrend phase.  The double top pattern is literally when a major resistance level is set and then retested.  The implication is that a lack of willing buyers means the uptrend is exhausted, and there is nowhere to go but down.

While the 21-day exponential moving average is currently in play for META, I would say that a break below the 50-day moving average could confirm this as the correct scenario.  If that smoothing mechanism does not hold, then the price action would imply less of a pullback and more like the beginning of a real distribution phase.

What is META pulls back but then resumes an uptrend phase, leading META to another new all-time high?  That would result in a confirmed cup and handle pattern, created by a large rounded bottoming pattern followed by a brief pullback.  The key to this pattern is the “rim” of the cup, which sits right at $740 for META.

Given the pullback META has demonstrated so far in July, I would say that a break above the $740 level would basically confirm a bullish cup and handle pattern.  That would suggest much more upside potential for META, as the stock would literally go into previously uncharted territory.

So how can we determine which scenario is more likely to play out?  This is where we need to incorporate more technical indicators into the discussion, as a way to further validate and confirm our investment thesis.

Just to review, I think a break above $740 would confirm a bullish cup and handle pattern.  I would also say that a break below the $680 level, which would represent a move below the 50-day moving average as well as the June swing lows, would basically confirm a bearish double top pattern.

We can also use the Relative Strength Index (RSI) to help determine whether META remains in a bullish trend phase.  During bull phases, the RSI rarely gets below 40, because buyers usually step in to “buy the dips” and keep the momentum fairly constructive.  So if the price would break down, and the RSI would not hold that crucial 40 level, that could mean a bearish outlook is warranted.

Finally, we can use volume-based indicators to assess whether moves in the price are supported by stronger volume readings.  Here I’ve included the Accumulation/Distribution Line, which tracks the trend in daily volume readings over time.  We can see that the high in July resulted in a divergence, as the A/D line was trending lower.  If the A/D line would break below its June and July lows, marked by a dashed red line, that would represent a bearish volume reading for META.

Technical analysis is less about predicting the future, and more about determining the most probable scenarios based on our analysis of trend, momentum, and volume.  I hope this discussion shows how the outlook for META can be easily determined and tracked using the best practices of technical analysis!

RR#6,

Dave

PS- Ready to upgrade your investment process?  Check out my free behavioral investing course!

David Keller, CMT

President and Chief Strategist

Sierra Alpha Research LLC

marketmisbehavior.com

https://www.youtube.com/c/MarketMisbehavior

Disclaimer: This blog is for educational purposes only and should not be construed as financial advice.  The ideas and strategies should never be used without first assessing your own personal and financial situation, or without consulting a financial professional.  

The author does not have a position in mentioned securities at the time of publication.    Any opinions expressed herein are solely those of the author and do not in any way represent the views or opinions of any other person or entity.

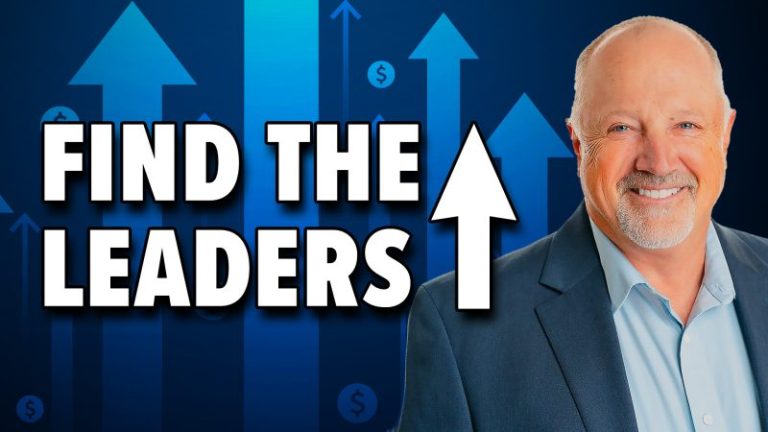
Is the market’s next surge already underway? Find out with Tom Bowley’s breakdown of where the money is flowing now and how you can get in front of it.

In this video, Tom covers key moves in the major indexes, revealing strength in transports, small caps, and home construction. He identifies industry rotation signals, which are pointing to aluminum, recreational products, and furnishings. Tom then demonstrates how to use StockCharts’ tools to scan for momentum stocks in emerging leadership groups — see why SGI tops Tom’s list. He ends with a discussion of post-earnings reactions from major names like GOOGL, TSLA, IBM, and LVS. 

And, of course, Tom wraps every idea with clear chart setups you can act on today. 

This video premiered on July 24, 2025. Click this link to watch on Tom’s dedicated page.

Missed a session? Archived videos from Tom are available at this link.

The S&P 500 ($SPX) just logged its fifth straight trading box breakout, which means that, of the five trading ranges the index has experienced since the April lows, all have been resolved to the upside.

How much longer can this last? That’s been the biggest question since the massive April 9 rally. Instead of assuming the market is due to roll over, it’s been more productive to track price action and watch for potential changes along the way. So far, drawdowns have been minimal, and breakouts keep occurring. Nothing in the price action hints at a lasting change — yet.

While some are calling this rally “historic,” we have a recent precedent. Recall that from late 2023 through early 2024, the index had a strong start and gave way to a consistent, steady trend.

From late October 2023 through March 2024, the S&P 500 logged seven consecutive trading box breakouts. That streak finally paused with a pullback from late March to early April, which, as we now know, was only a temporary hiccup. Once the bid returned, the S&P 500 went right back to carving new boxes and climbing higher.

New 52-Week Highs Finally Picking Up

If there’s been one gripe about this rally, it’s that the number of new highs within the index has lagged. As we’ve discussed before, among all the internal breadth indicators available, new highs almost always lag — that’s normal. What we really want to see is whether the number of new highs begins to exceed prior peaks as the market continues to rise, which it has, as shown by the blue line in the chart below.

As of Wednesday’s close, 100 S&P 500 stocks were either at new 52-week highs or within 3% of them. That’s a strong base. We expect this number to continue rising as the market climbs, especially if positive earnings reactions persist across sectors.

Even when we get that first day with 100+ S&P 500 stocks making new 52-week highs, though, it might not be the best time to initiate new longs.

The above chart shows that much needs to align for that many stocks to peak in unison, which has historically led to at least a short-term consolidation, if not deeper pullbacks — as highlighted in yellow. Every time is different, of course, but this is something to keep an eye on in the coming weeks.

Trend Check: GoNoGo Still “Go”

The GoNoGo Trend remains in bullish mode, with the recent countertrend signals having yet to trigger a greater pullback.

Active Bullish Patterns

We still have two live bullish upside targets of 6,555 and 6,745, which could be with us for a while going forward. For the S&P 500 to get there, it will need to form new, smaller versions of the trading boxes.

Failed Bearish Patterns

In the chart below, you can view a rising wedge pattern on the recent price action, the third since April. The prior two wedges broke down briefly and did not lead to a major downturn. The largest pullbacks in each case occurred after the S&P 500 dipped below the lower trendline of the pattern.

The deepest drawdown so far is 3.5%, which is not exactly a game-changer. Without downside follow-through, a classic bearish pattern simply can’t be formed, let alone be broken down from.

We’ll continue to monitor these formations as they develop because, at some point, that will change.

Here are some charts that reflect our areas of focus this week at


XLU Leads with New High

Even though the Utilities SPDR (XLU) cannot keep pace with the Technology SPDR (XLK) and Communication Services SPDR (XLC), it is in a leading uptrend. XLU formed a cup-with-handle from November to July and broke to new highs the last two weeks. ETFs hitting new highs are in strong uptrends and should be on our radar.


Metal Mania in 2025

In a tribute to Ozzy, metals are leading the way higher in 2025. The PerfChart below shows year-to-date performance for the continuous futures for 12 commodities. Copper, Platinum and Palladium are up more than 45% year-to-date, while Gold is up 28.38% and Silver is up 35.30%. QQQ is up 10.52% year-to-date, but lagging these metals. The other commodities are mixed.


Multi-Year Highs for Silver and Copper

The next chart shows 11 year bar charts for five metals. Gold broke out in early 2024 and led the metals move with an advance the last 21 months. Silver and copper broke out to multi-year highs. Platinum broke above its 2021 high and Palladium got in the action with an 18 month high. There is a clear message here: metals are moving higher and leading as a group.  


Home Construction Hits Moment of Truth

The Home Construction ETF (ITB) hit its moment of truth as it rose to its falling 40-week SMA. Notice that ITB failed just below this moving average in August 2023. During the 2023-2024 uptrend, the 40-week SMA was more friendly as ITB reversed near this level in October 2023 and June 2024. ITB surged to the falling 40-week SMA in July, but the long-term trend is down and this area could be its nemesis.

Thanks for Tuning in!

See TrendInvestorPro.com for more


A group of the country’s top economic leaders, including every living former Federal Reserve chair, filed an amicus brief with the Supreme Court on Thursday in support of Fed governor Lisa Cook, who President Donald Trump is seeking to remove.

The group, led former central bank chiefs Alan Greenspan, Ben Bernanke and Janet Yellen, said that “allowing the removal of Governor Lisa D. Cook while the challenge to her removal is pending would threaten that independence and erode public confidence in the Fed.”

The bipartisan group, which also includes former Treasury Secretaries Robert Rubin, Larry Summers, Hank Paulson, Jack Lew and Timothy Geithner, added that “the independence of the Federal Reserve, within the limited authority granted by Congress to achieve the goals Congress itself has set, is a critical feature of our national monetary system.”

As the U.S. central bank, the Federal Reserve is part of the U.S. government and its leaders are put in place by elected officials, but it also retains a considerable amount of independence that is meant to allow it to make decisions purely out of economic concerns rather than political ones.

The former economic officials said that an erosion of Fed independence could result “in substantial long-term harm and inferior economic performance overall.”

The Supreme Court is considering whether Trump has the authority to fire Cook, who has been a target for the White House for weeks as part of a broader pressure campaign to push the Fed to more aggressively cut interest rates.

Cook’s attempted removal stems from allegations of mortgage fraud, made in August by top Trump ally and Federal Housing Finance Authority Director Bill Pulte.

Cook has repeatedly denied the allegations and has not been charged with any crime. Documents reviewed by NBC News in mid-September appeared to contradict Pulte’s allegations.

Two courts have so far blocked Cook’s removal, leading Trump to ask the Supreme Court a week ago to allow him to fire her. In a court filing, Solicitor General D. John Sauer said a judge’s ruling that blocked the firing constituted “improper judicial interference.”

In a filing to the Supreme Court on Thursday, Cook’s lawyers said that ‘she committed neither ‘fraud’ nor ‘gross negligence’ in relation to her mortgages.’

Cook asked the court to deny Trump’s attempt to remove her while the case is argued.

The White House has repeatedly maintained that Trump “lawfully removed Lisa Cook for cause.”

The brief filed Thursday is a who’s who of the country’s top economic minds. Former Fed governor Dan Tarullo is also listed as a signatory to the brief, as well as the economists Ken Rogoff, Phil Gramm and John Cochrane.

Glenn Hubbard, Greg Mankiw, Christina Romer, Cecilia Rouse, Jared Bernstein and Jason Furman, a group who served as top officials on the White House’s council of economic advisers during Republican and Democrat administrations, also signed the brief.

None of the officials who signed the filing have served in either of Trump’s administrations.

Lisa Cook is sworn in during a Senate Banking hearing in 2023.Drew Angerer / Getty Images file

Trump is the first president in U.S. history to try to remove a sitting Fed official.

‘There is broad consensus among economists, based on decades of macroeconomic research, that a more independent central bank will lead to lower and more stable inflation without creating higher unemployment — thus helping to achieve the Federal Reserve’s statutory objective of price stability and maximum employment,’ the officials said in the brief.

‘The Federal Reserve walks a careful line in pursuit of its goals.’

They noted that ‘elected officials often favor lowering interest rates to boost employment, particularly leading up to an election.’

‘Although that approach may satisfy voters temporarily, it does not lead to lasting gains for unemployment or growth and can instead lead to persistently higher inflation in the long-term and thus ultimately harm the national economy.’

The former Fed chairs and economic officials, in their filing, highlight a notorious case of political pressure on the Fed:

‘In the early 1970s, President Richard Nixon famously exerted political pressure over then-Chair of the Fed Arthur Burns to lower unemployment by reducing interest rates. During this period ‘the Fed made only limited efforts to maintain policy independence and, for doctrinal as well as political reasons, enabled a decade of high and volatile inflation.’ This contributed to an ‘inflationary boom’ and deep recession that took years to bring back under control.’

This post appeared first on NBC NEWS

The owners of nearly 200,000 BMWs should park their vehicles outside because they risk catching fire while parked or being driven, the National Highway Traffic Safety Administration announced Friday.

The vehicle models affected include 2019-22 Z4; 2019-21 330I; 2020-22 X3; 2020-22 X4; 2020-22 530I; 2021-22 430I standard and convertible; 2022 230I; and roughly 1,500 20-2022 Toyota Supra vehicles manufactured by BMW, NHTSA said in a news release.

The federal agency said the vehicles’ engine starter relay may corrode, “causing the relay to overheat and short circuit, which may cause a fire.”

“Owners should park outside and away from buildings and other vehicles until they either confirm their vehicle is not subject to the recall or have their vehicle remedied,” NHTSA said.

BMW did not immediately return a request for comment.

NHTSA said the German automaker will be conducting a phased recall due to parts availability. Interim notification letters to owners are scheduled to be mailed on Nov. 14, with a second notice to be sent as remedy parts are available, the agency added.

Vehicle identification numbers for affected vehicles will be searchable on NHTSA.gov starting Nov. 14, the agency said.

Beginning on that date, car owners can visit NHTSA.gov/recalls and enter their license plate number or 17-digit VIN to see if their vehicle is under recall. They can also call NHTSA’s Vehicle Safety Hotline at 888-327-4236.

NHTSA also advised owners of the BMWs to call the company with any questions.

The German automaker recalled more than 1 million cars and SUVs in 2017 over similar issues. The recall was expanded to another 185,000 vehicles in 2019.

This post appeared first on NBC NEWS

Jerry Greenfield, co-founder of the Ben & Jerry’s ice cream brand, has stepped down from the company he started 47 years ago citing a retreat from its campaigning spirit under parent company Unilever.

Greenfield wrote in an open letter late Tuesday night — shared on X by his co-founder Ben Cohen — that he could no longer ‘in good conscience’ remain an employee of the company and said the company had been ‘silenced.’

He said the company’s values and campaigning work on ‘peace, justice, and human rights’ allowed it to be ‘more than just an ice cream company’ and said the independence to pursue this was guaranteed when Anglo-Dutch packaged food giant Unilever bought the brand in 2000 for $326 million.

Cohen’s statement didn’t mention Israel’s ongoing military operation in Gaza, but Ben & Jerry’s has been outspoken on the treatment of Palestinians for years and in 2021 withdrew sales from Israeli settlements in what it called ‘Occupied Palestinian Territory.’

Greenfield’s resignation comes five months after Ben & Jerry’s filed a lawsuit accusing Unilever of firing its chief executive, David Stever, over his support for the brand’s political activism. In November last year Ben & Jerry’s filed another lawsuit accusing Unilever of silencing its public statements in support of Palestinian refugees.

‘It’s profoundly disappointing to come to the conclusion that that independence, the very basis of our sale to Unilever, is gone,’ Greenfield said.

‘And it’s happening at a time when our country’s current administration is attacking civil rights, voting rights, the rights of immigrants, women, and the LGBTQ community,’ he added.

Jerry Greenfield, left, and Bennett Cohen, the founders of Ben and Jerry’s founders, in Burlington, Vt., in 1987.Toby Talbot / AP file

Richard Goldstein, the then president of Unilever Foods North America, said in a statement after the sale in 2000 that Unilever was ‘in an ideal position to bring the Ben & Jerry’s brand, values and socially responsible message to consumers worldwide.’

But now Greenfield claims Ben & Jerry’s ‘has been silenced, sidelined for fear of upsetting those in power.’ He said he would carry on campaigning on social justice issues outside the company.

The financial performance of the Ben & Jerry’s brand isn’t made public but Unilever’s ice cream division made 8.3 billion Euros ($9.8 billion) in revenue in 2024. Unilever is in the process of spinning off its ice cream division, however, into a separate entity which involves cutting some 7,500 jobs across its brands globally.

Cohen and Greenfield founded the business in 1978 in Burlington, Vermont, where it is still based.

NBC News has contacted Unilever for comment overnight but had not received any at the time of publication.

This post appeared first on NBC NEWS

SEATTLE — Amazon has reached a historic $2.5 billion settlement with the Federal Trade Commission, which said the online retail giant tricked customers into signing up for its Prime memberships and made it difficult for them to cancel after doing so.

The Seattle company will pay $1 billion in civil penalties — the largest fine in FTC history, and $1.5 billion will be paid to consumers who were unintentionally enrolled in Prime, or were deterred from canceling their subscriptions, the agency said Thursday. Eligible Prime customers include those who may have signed up for a membership via the company’s “Single Page Checkout” between June 23, 2019 to June 23, 2025.

The Federal Trade Commission sued Amazon in U.S. District Court in Seattle two years ago alleging more than a decade of legal violations. That included a violation of the Restore Online Shoppers’ Confidence Act, a 2010 law designed to ensure that people know what they’re being charged for online.

Amazon admitted no wrong-doing in the settlement. It did not immediately respond to requests by The Associated Press for comment Thursday.

Amazon Prime provides subscribers with perks that include faster shipping, video streaming and discounts at Whole Foods for a fee of $139 annually, or $14.99 a month.

It’s a key and growing part of Amazon’s business, with more than 200 million members. In its latest financial report, the company reported in July that it booked more than $12 billion in net revenue for subscription services, a 12% increase from the same period last year. That figure includes annual and monthly fees associated with Prime memberships, as well as other subscription services such as its music and e-books platforms.

The company has said that it clearly explains Prime’s terms before charging customers, and that it offers simple ways to cancel membership, including by phone, online and by online chat.

“Occasional customer frustrations and mistakes are inevitable — especially for a program as popular as Amazon Prime,” Amazon said in a trial brief filed last month.

But the FTC said Amazon deliberately made it difficult for customers to purchase an item without also subscribing to Prime. In some cases, consumers were presented with a button to complete their transactions — which did not clearly state it would also enroll them in Prime, the agency said.

Getting out of a subscription was often too complicated, and Amazon leadership slowed or rejected changes that would have made canceling easier, according to an FTC complaint.

Internally, Amazon called the process “Iliad,” a reference to the ancient Greek poem about the lengthy siege of Troy during the Trojan war. The process requires the customer to affirm on three pages their desire to cancel membership.

The FTC began looking into Amazon’s Prime subscription practices in 2021 during the first Trump administration, but the lawsuit was filed in 2023 under former FTC Chair Lina Khan, an antitrust expert who had been appointed by Biden.

The agency filed the case months before it submitted an antitrust lawsuit against the retail and technology company, accusing it of having monopolistic control over online markets.

This post appeared first on NBC NEWS

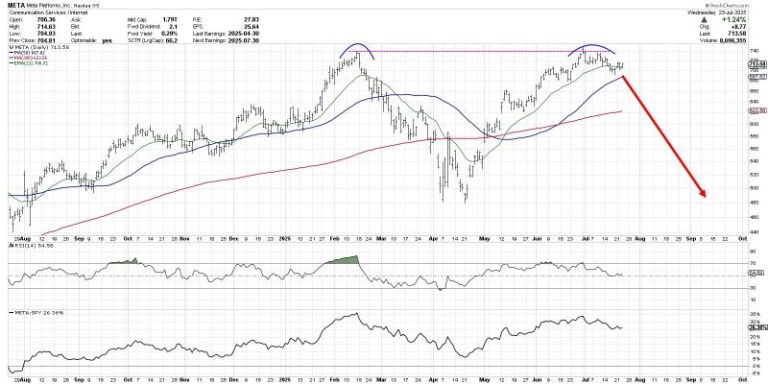
The chart of Meta Platforms, Inc. (META) has completed a roundtrip from the February high around $740 to the April low at $480 and all the way back again.  Over the last couple weeks, META has now pulled back from its retest of all-time highs, leaving investors to wonder what may come next.

Is this the beginning of a new downtrend phase for META?  Or just a brief pullback before a new uptrend phase propels META to new all-time highs?

Today we’ll look at two potential scenarios, including the double top pattern and the cup and handle pattern, and share which technical indicators and approaches could help us determine which path plays out into August.

The double top scenario basically means that the late July retest of the previous all-time high was the end of the recent uptrend phase.  The double top pattern is literally when a major resistance level is set and then retested.  The implication is that a lack of willing buyers means the uptrend is exhausted, and there is nowhere to go but down.

While the 21-day exponential moving average is currently in play for META, I would say that a break below the 50-day moving average could confirm this as the correct scenario.  If that smoothing mechanism does not hold, then the price action would imply less of a pullback and more like the beginning of a real distribution phase.

What is META pulls back but then resumes an uptrend phase, leading META to another new all-time high?  That would result in a confirmed cup and handle pattern, created by a large rounded bottoming pattern followed by a brief pullback.  The key to this pattern is the “rim” of the cup, which sits right at $740 for META.

Given the pullback META has demonstrated so far in July, I would say that a break above the $740 level would basically confirm a bullish cup and handle pattern.  That would suggest much more upside potential for META, as the stock would literally go into previously uncharted territory.

So how can we determine which scenario is more likely to play out?  This is where we need to incorporate more technical indicators into the discussion, as a way to further validate and confirm our investment thesis.

Just to review, I think a break above $740 would confirm a bullish cup and handle pattern.  I would also say that a break below the $680 level, which would represent a move below the 50-day moving average as well as the June swing lows, would basically confirm a bearish double top pattern.

We can also use the Relative Strength Index (RSI) to help determine whether META remains in a bullish trend phase.  During bull phases, the RSI rarely gets below 40, because buyers usually step in to “buy the dips” and keep the momentum fairly constructive.  So if the price would break down, and the RSI would not hold that crucial 40 level, that could mean a bearish outlook is warranted.

Finally, we can use volume-based indicators to assess whether moves in the price are supported by stronger volume readings.  Here I’ve included the Accumulation/Distribution Line, which tracks the trend in daily volume readings over time.  We can see that the high in July resulted in a divergence, as the A/D line was trending lower.  If the A/D line would break below its June and July lows, marked by a dashed red line, that would represent a bearish volume reading for META.

Technical analysis is less about predicting the future, and more about determining the most probable scenarios based on our analysis of trend, momentum, and volume.  I hope this discussion shows how the outlook for META can be easily determined and tracked using the best practices of technical analysis!

RR#6,

Dave

PS- Ready to upgrade your investment process?  Check out my free behavioral investing course!

David Keller, CMT

President and Chief Strategist

Sierra Alpha Research LLC

marketmisbehavior.com

https://www.youtube.com/c/MarketMisbehavior

Disclaimer: This blog is for educational purposes only and should not be construed as financial advice.  The ideas and strategies should never be used without first assessing your own personal and financial situation, or without consulting a financial professional.  

The author does not have a position in mentioned securities at the time of publication.    Any opinions expressed herein are solely those of the author and do not in any way represent the views or opinions of any other person or entity.
Is the market’s next surge already underway? Find out with Tom Bowley’s breakdown of where the money is flowing now and how you can get in front of it.

In this video, Tom covers key moves in the major indexes, revealing strength in transports, small caps, and home construction. He identifies industry rotation signals, which are pointing to aluminum, recreational products, and furnishings. Tom then demonstrates how to use StockCharts’ tools to scan for momentum stocks in emerging leadership groups — see why SGI tops Tom’s list. He ends with a discussion of post-earnings reactions from major names like GOOGL, TSLA, IBM, and LVS. 

And, of course, Tom wraps every idea with clear chart setups you can act on today. 

This video premiered on July 24, 2025. Click this link to watch on Tom’s dedicated page.

Missed a session? Archived videos from Tom are available at this link.