Author

admin

Browsing

Here’s a quick recap of the crypto landscape for March 11 as of 9:00 a.m. UTC.

Get the latest insights on Bitcoin, Ether and altcoins, along with a round-up of key cryptocurrency market news.

Bitcoin (BTC) was priced at US$69,624.27, down by 1.7 percent over the last 24 hours.

Bitcoin price performance, March 11, 2026.

Chart via TradingView

Ether (ETH) was priced at US$2,022.91, down by 1.6 percent over the last 24 hours.

Altcoin price update

  • XRP (XRP) was priced at US$1.37, down by 2.0 percent over 24 hours.
  • Solana (SOL) was trading at US$85.39, up by 2.1 percent over 24 hours.

Today’s crypto news to know

Oil trading surges on crypto derivatives platform

Volatility in global energy markets is spilling into crypto trading platforms, where oil derivatives have suddenly become one of the most active markets.

On decentralized exchange Hyperliquid, an oil-linked perpetual futures contract tracking West Texas Intermediate crude generated about US$1.32 billion in trading volume over the past 24 hours.

The surge made oil the second-most traded contract on the platform after Bitcoin.

The surge followed the escalation of the US-Israel conflict with Iran, which sent oil prices briefly soaring above US$118 per barrel before retreating. Prior to the conflict, the contract typically saw about US$21 million in daily trading.

Data from Hyperliquid shows Bitcoin still dominates trading activity with roughly US$3.64 billion in daily volume, but the WTI contract has now leapfrogged assets such as Ether, silver, and gold.

Strategy adds nearly 18,000 Bitcoin in US$1.28 billion purchase

Strategy (NASDAQ:MSTR) continued its aggressive accumulation strategy last week, revealing it purchased 17,994 Bitcoin for about US$1.28 billion between March 2 and March 8.

According to a regulatory filing, the company paid an average price of roughly US$70,946 per coin. The latest purchase lifts Strategy’s total holdings to 738,731 Bitcoin, acquired at a combined cost of about US$56.04 billion.

China’s top court warns of tougher penalties for crypto crime

China’s Supreme People’s Court has signaled a harder line against cryptocurrency-related financial crime, pledging stricter penalties for individuals using digital assets to launder money or move funds overseas.

Chief Justice Zhang Jun issued the warning in the court’s annual report to the National People’s Congress, highlighting the growing role of crypto in cross-border financial offenses.

Authorities say the crackdown is part of a broader campaign against technology-enabled crime, which increasingly includes artificial intelligence-driven fraud and coordinated online harassment campaigns known as “human flesh search.”

Despite the ban, enforcement agencies say criminals have continued to exploit digital assets to bypass China’s strict capital controls, which limit individuals to transferring US$50,000 abroad each year.

Securities Disclosure: I, Meagen Seatter, hold no direct investment interest in any company mentioned in this article.

Securities Disclosure: I, Giann Liguid, hold no direct investment interest in any company mentioned in this article.

This post appeared first on investingnews.com

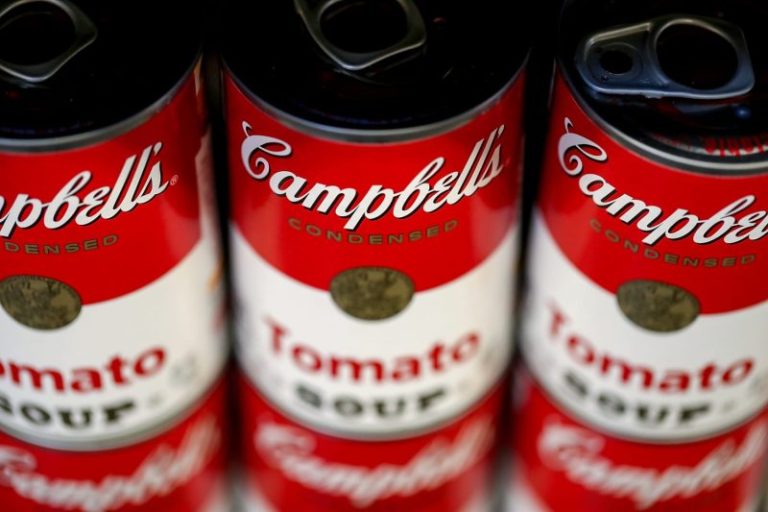
Campbell’s has fired an executive accused of making racist comments and mocking its products and customers, the company announced on Wednesday.

The termination follows a lawsuit filed in Michigan by former employee Robert Garza against Campbell’s, the company’s then-vice president of information technology Martin Bally and another manager.

The complaint alleges retaliation and a hostile work environment, citing a November 2024 meeting between Bally and Garza to discuss salary, according to the lawsuit.

Garza allegedly recorded the conversation, and the audio — obtained by NBC News — is more than 90 minutes long.

During the interaction, the lawsuit alleges that Bally described Campbell’s as “highly process(ed) food” and said it was for “poor people.” He also allegedly made racist remarks about Indian workers, calling them “idiots.”

‘After a review, we believe the voice on the recording is in fact Martin Bally,’ Campbell’s said Wednesday. ‘The comments were vulgar, offensive and false, and we apologize for the hurt they have caused.’

The company said it does not tolerate the language used in the audio recording and the behavior “does not reflect” its values.

Campbell’s said it learned of the litigation and first heard segments of the audio on Nov. 20.

Bally’s termination was effective Tuesday, the company said.

According to the lawsuit, Garza told his manager, J.D. Aupperle — who is also named as a defendant, about Bally’s behavior in January 2025 and wanted to report the comments to the human resources department. He was not encouraged to report the comments, the lawsuit claims, and was then ‘abruptly terminated from employment’ later that month.

‘This situation has been very hard on Robert,’ Garza’s attorney, Zachary Runyan, said in a statement to NBC News on Tuesday. ‘He thought Campbell’s would be thankful that he reported Martin’s behavior, but instead he was abruptly fired.’

Garza is seeking monetary damages from the company.

Bally and Aupperle did not immediately return requests for comment on Wednesday.

Campbell’s said it is ‘proud of the food we make’ and ‘the comments heard on the recording about our food are not only inaccurate — they are patently absurd.’

This post appeared first on NBC NEWS

/NOT FOR DISTRIBUTION TO UNITED STATES NEWS WIRE SERVICES OR FOR DISSEMINATION IN THE UNITED STATES/

1911 Gold Corporation (‘1911 Gold’ or the ‘Company’) (TSXV: AUMB) (OTCQX: AUMBF) (FRA: 2KY) is pleased to announce that, further to the news release dated February 20, 2026, the Company has closed the initial drawdown of US$15 million (the ‘Tranche 1 Amount’) under the loan agreement dated February 19, 2026 (the ‘Loan Agreement’) with Auramet International, Inc. (‘Auramet’), which provides for a US$30 million secured credit facility (the ‘Credit Facility’). It is anticipated that the proceeds from the Credit Facility, including the Tranche 1 Amount, will be used to advance critical operational milestones at the True North Gold Project, specifically providing the capital required to purchase essential mining equipment, underground development at the True North mine, and the installation of the new crushing circuit at the mill.

The outstanding principal amount under the Credit Facility accrues interest at a rate of 12% per annum calculated and payable monthly in arrears on the last business day of each calendar month; provided, however, that no interest shall accrue on the Tranche 1 Amount for a period of six months following the closing date of the initial drawdown of the Tranche 1 Amount (the ‘Closing Date‘). The Tranche 1 Amount shall be amortized and repaid to Auramet in 12 equal monthly instalments of US$1.25 million commencing on the date that is 13 months following the Closing Date and ending on the date that is 24 months following the Closing Date (the ‘Maturity Date‘).

The obligations under the Loan Agreement are secured by a first-ranking security interest on all personal property of the Company and a continuing collateral mortgage against the Company’s True North Gold Project and Rice Lake exploration properties. The Loan Agreement includes terms and conditions customary for a transaction of this nature, including certain specified positive and negative covenants and mandatory prepayment terms.

Subject to the satisfaction of certain conditions precedent, the remaining US$15 million of the Credit Facility will be made available during the period commencing on the date that is 90 days following the Closing Date and ending on the date that is 180 days following the Closing Date.

In consideration for the arrangement of the Credit Facility, on the Closing Date, the Company paid Auramet an arrangement fee of US$1,050,000, representing 3.5% of the aggregate principal amount of the Credit Facility, which fee was satisfied by the issuance of 1,369,600 common shares in the capital of the Company (‘Common Shares‘) at a deemed price of C$1.05 per Common Share. Additionally, in consideration for the lending of the Tranche 1 Amount, on the Closing Date, the Company paid Auramet a drawdown fee of US$375,000, representing 2.5% of the Tranche 1 Amount, which fee was satisfied by the issuance of 489,142 Common Shares at a deemed price of C$1.05 per Common Share, and issued to Auramet 4,500,000 common share purchase warrants of the Company (the ‘Tranche 1 Warrants‘), with each Tranche 1 Warrant exercisable to purchase one Common Share at an exercise price equal to C$1.07 per Common Share, representing a 10% premium to the 5-day volume-weighted average price of the Common Shares on the TSXV for the five consecutive trading days ending on (and including) the date of the Loan Agreement, with such Tranche 1 Warrants expiring on the Maturity Date, subject to acceleration.

The Common Shares and the Tranche 1 Warrants issuable pursuant to the Loan Agreement and the Common Shares underlying the Tranche 1 Warrants are subject to a four-month statutory hold period under applicable Canadian securities laws, which will expire on July 10, 2026.

The securities issuable pursuant to the Loan Agreement have not been, and will not be, registered under the United States Securities Act of 1933, as amended (the ‘U.S. Securities Act‘), or any U.S. state securities laws, and may not be offered or sold in the United States or to, or for the account or benefit of, U.S. persons absent registration under the U.S. Securities Act and all applicable state securities laws or compliance with the requirements of an applicable exemption therefrom. This news release shall not constitute an offer to sell or the solicitation of an offer to buy in the United States, nor shall there be any sale of the securities in any state in which such offer, solicitation or sale would be unlawful.

About Auramet

Auramet is a private company established in 2004 by seasoned professionals who have assembled a global team of industry specialists with over 400 years combined industry experience. It is one of the largest physical precious metals merchants in the world and has provided over $1.5 billion in term financing facilities to date. Auramet offers a full range of services, including physical metals trading, metals merchant banking (including direct lending), and project finance advisory services to all participants in the precious metals supply chain.

About 1911 Gold Corporation

1911 Gold is an advanced gold explorer and developer focused on its 100%-owned True North Gold Project in the Archean Rice Lake Greenstone Belt in Manitoba, Canada. The Company controls a large, highly prospective ~62,000-hectare land package with numerous past-producing gold operations within trucking distance of the fully built and permitted True North mine and mill complex. 1911 Gold is positioning itself to restart operations in 2027 and offers a unique, near-term production opportunity with significant exploration upside. The strategy is to build a district-scale gold mining operation around a centralized, and readily expandable infrastructure to support a socially and environmentally responsible, long-term mining operation with little development risk and a growing mineral resource base.

1911 Gold’s True North complex and the exploration land package are located within and among the First Nation communities of the Hollow Water First Nation and the Black River First Nation. 1911 Gold looks forward to maintaining open, cooperative, and respectful communications with all of our local communities and stakeholders to foster mutually beneficial working relationships.

ON BEHALF OF THE BOARD OF DIRECTORS

Shaun Heinrichs
President and CEO

www.1911gold.com

CAUTIONARY STATEMENT REGARDING FORWARD-LOOKING INFORMATION

This news release contains forward-looking information or forward-looking statements within the meaning of applicable securities laws (collectively, ‘forward-looking statements‘). Often, but not always, forward-looking statements can be identified by the use of words and phrases such as ‘plans’, ‘expects’ or ‘does not expect’, ‘is expected’, ‘budget’, ‘scheduled’, ‘estimates’, ‘forecasts’, ‘intends’, ‘anticipates’ or ‘does not anticipate’, or ‘believes’, or that describe a ‘goal’, or variations of such words and phrases, or statements that certain actions, events or results ‘may’, ‘could’, ‘would’, ‘might’ or ‘will’ be taken, occur or be achieved.

All statements that address expectations or projections about the future, including, but not limited to, statements about the use of proceeds of the Credit Facility, including the Tranche 1 Amount, the timing and ability of the Company to satisfy the conditions precedent in respect of the drawdown of the remaining principal amount under the Credit Facility and the Company’s objectives, goals and future plans and strategies, are forward-looking statements. 

All forward-looking statements reflect the Company’s beliefs and assumptions based on information available at the time the statements were made. Actual results or events may differ from those predicted in these forward-looking statements. All of the Company’s forward-looking statements are qualified by the assumptions that are stated or inherent in such forward-looking statements, including the assumptions listed below. Although the Company believes that these assumptions are reasonable, this list is not exhaustive of factors that may affect any of the forward-looking statements.

Forward-looking statements involve known and unknown risks, future events, conditions, uncertainties and other factors which may cause the actual results, performance or achievements to be materially different from any future results, predictions, projections, forecasts, performance or achievements expressed or implied by the forward-looking statements, including, but not limited to, the Company’s inability to satisfy the conditions precedent in respect of the drawdown of the remaining principal amount under the Credit Facility and the Company’s inability to repay the Credit Facility or comply with the covenants set out in the Loan Agreement.

Although 1911 Gold has attempted to identify important factors that could cause actual actions, events or results to differ materially from those described in forward-looking statements, there may be other factors that cause actions, events or results not to be as anticipated, estimated or intended. There can be no assurance that forward-looking statements will prove to be accurate, as actual results and future events could differ materially from those anticipated in such statements. Accordingly, readers should not place undue reliance on forward-looking statements.

All forward-looking statements contained in this news release are given as of the date hereof. The Company disclaims any intention or obligation to update or revise any forward-looking statements whether as a result of new information, future events or otherwise, except in accordance with applicable securities laws.

Neither TSX Venture Exchange nor its Regulation Services Provider (as that term is defined in policies of the TSX Venture Exchange) accepts responsibility for the adequacy or accuracy of this release.

SOURCE 1911 Gold Corporation

View original content to download multimedia: http://www.newswire.ca/en/releases/archive/March2026/09/c6182.html


News Provided by Canada Newswire via QuoteMedia

This post appeared first on investingnews.com

Markets don’t usually hit record highs, risk falling into bearish territory, and spring back to new highs within six months. But that’s what happened in 2025.

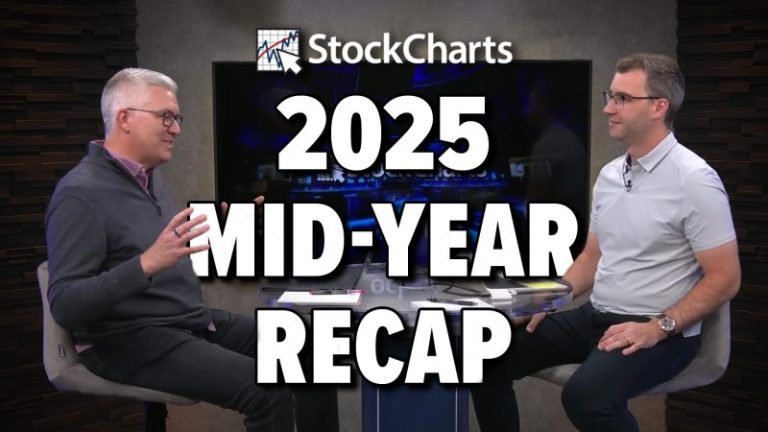
In this special mid-year recap, Grayson Roze sits down with David Keller, CMT, to show how disciplined routines, price-based signals, and a calm process helped them ride the whipsaw instead of getting tossed by it. You’ll see what really happened under the surface, how investor psychology drove the swings, and the exact StockCharts tools they leaned on to stay objective. 

If you’re focused on protecting capital, generating income, and sleeping well at night while still capturing the upside, this is a must-watch. Discover which charts deserve your attention now, what to ignore, and how to prep for the back half of 2025. 

This video premiered on July 23, 2025. Click on the above image to watch on our dedicated Grayson Roze page on StockCharts TV.

You can view previously recorded videos from Grayson at this link.

Is the market’s next surge already underway? Find out with Tom Bowley’s breakdown of where the money is flowing now and how you can get in front of it.

In this video, Tom covers key moves in the major indexes, revealing strength in transports, small caps, and home construction. He identifies industry rotation signals, which are pointing to aluminum, recreational products, and furnishings. Tom then demonstrates how to use StockCharts’ tools to scan for momentum stocks in emerging leadership groups — see why SGI tops Tom’s list. He ends with a discussion of post-earnings reactions from major names like GOOGL, TSLA, IBM, and LVS. 

And, of course, Tom wraps every idea with clear chart setups you can act on today. 

This video premiered on July 24, 2025. Click this link to watch on Tom’s dedicated page.

Missed a session? Archived videos from Tom are available at this link.

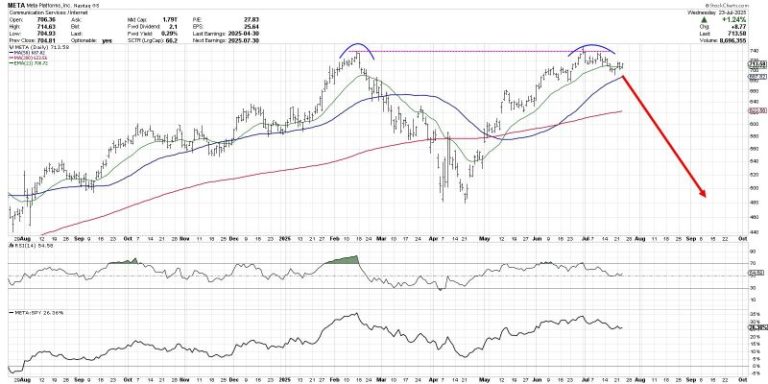
The chart of Meta Platforms, Inc. (META) has completed a roundtrip from the February high around $740 to the April low at $480 and all the way back again.  Over the last couple weeks, META has now pulled back from its retest of all-time highs, leaving investors to wonder what may come next.

Is this the beginning of a new downtrend phase for META?  Or just a brief pullback before a new uptrend phase propels META to new all-time highs?

Today we’ll look at two potential scenarios, including the double top pattern and the cup and handle pattern, and share which technical indicators and approaches could help us determine which path plays out into August.

The double top scenario basically means that the late July retest of the previous all-time high was the end of the recent uptrend phase.  The double top pattern is literally when a major resistance level is set and then retested.  The implication is that a lack of willing buyers means the uptrend is exhausted, and there is nowhere to go but down.

While the 21-day exponential moving average is currently in play for META, I would say that a break below the 50-day moving average could confirm this as the correct scenario.  If that smoothing mechanism does not hold, then the price action would imply less of a pullback and more like the beginning of a real distribution phase.

What is META pulls back but then resumes an uptrend phase, leading META to another new all-time high?  That would result in a confirmed cup and handle pattern, created by a large rounded bottoming pattern followed by a brief pullback.  The key to this pattern is the “rim” of the cup, which sits right at $740 for META.

Given the pullback META has demonstrated so far in July, I would say that a break above the $740 level would basically confirm a bullish cup and handle pattern.  That would suggest much more upside potential for META, as the stock would literally go into previously uncharted territory.

So how can we determine which scenario is more likely to play out?  This is where we need to incorporate more technical indicators into the discussion, as a way to further validate and confirm our investment thesis.

Just to review, I think a break above $740 would confirm a bullish cup and handle pattern.  I would also say that a break below the $680 level, which would represent a move below the 50-day moving average as well as the June swing lows, would basically confirm a bearish double top pattern.

We can also use the Relative Strength Index (RSI) to help determine whether META remains in a bullish trend phase.  During bull phases, the RSI rarely gets below 40, because buyers usually step in to “buy the dips” and keep the momentum fairly constructive.  So if the price would break down, and the RSI would not hold that crucial 40 level, that could mean a bearish outlook is warranted.

Finally, we can use volume-based indicators to assess whether moves in the price are supported by stronger volume readings.  Here I’ve included the Accumulation/Distribution Line, which tracks the trend in daily volume readings over time.  We can see that the high in July resulted in a divergence, as the A/D line was trending lower.  If the A/D line would break below its June and July lows, marked by a dashed red line, that would represent a bearish volume reading for META.

Technical analysis is less about predicting the future, and more about determining the most probable scenarios based on our analysis of trend, momentum, and volume.  I hope this discussion shows how the outlook for META can be easily determined and tracked using the best practices of technical analysis!

RR#6,

Dave

PS- Ready to upgrade your investment process?  Check out my free behavioral investing course!

David Keller, CMT

President and Chief Strategist

Sierra Alpha Research LLC

marketmisbehavior.com

https://www.youtube.com/c/MarketMisbehavior

Disclaimer: This blog is for educational purposes only and should not be construed as financial advice.  The ideas and strategies should never be used without first assessing your own personal and financial situation, or without consulting a financial professional.  

The author does not have a position in mentioned securities at the time of publication.    Any opinions expressed herein are solely those of the author and do not in any way represent the views or opinions of any other person or entity.

Here are some charts that reflect our areas of focus this week at


XLU Leads with New High

Even though the Utilities SPDR (XLU) cannot keep pace with the Technology SPDR (XLK) and Communication Services SPDR (XLC), it is in a leading uptrend. XLU formed a cup-with-handle from November to July and broke to new highs the last two weeks. ETFs hitting new highs are in strong uptrends and should be on our radar.


Metal Mania in 2025

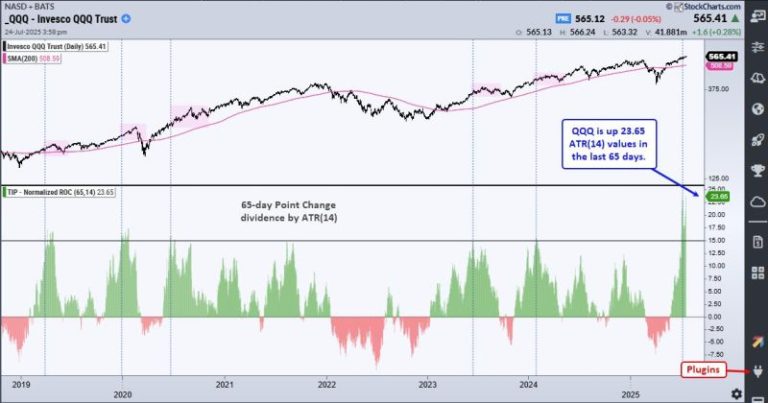
In a tribute to Ozzy, metals are leading the way higher in 2025. The PerfChart below shows year-to-date performance for the continuous futures for 12 commodities. Copper, Platinum and Palladium are up more than 45% year-to-date, while Gold is up 28.38% and Silver is up 35.30%. QQQ is up 10.52% year-to-date, but lagging these metals. The other commodities are mixed.


Multi-Year Highs for Silver and Copper

The next chart shows 11 year bar charts for five metals. Gold broke out in early 2024 and led the metals move with an advance the last 21 months. Silver and copper broke out to multi-year highs. Platinum broke above its 2021 high and Palladium got in the action with an 18 month high. There is a clear message here: metals are moving higher and leading as a group.  


Home Construction Hits Moment of Truth

The Home Construction ETF (ITB) hit its moment of truth as it rose to its falling 40-week SMA. Notice that ITB failed just below this moving average in August 2023. During the 2023-2024 uptrend, the 40-week SMA was more friendly as ITB reversed near this level in October 2023 and June 2024. ITB surged to the falling 40-week SMA in July, but the long-term trend is down and this area could be its nemesis.

Thanks for Tuning in!

See TrendInvestorPro.com for more


The S&P 500 ($SPX) just logged its fifth straight trading box breakout, which means that, of the five trading ranges the index has experienced since the April lows, all have been resolved to the upside.

How much longer can this last? That’s been the biggest question since the massive April 9 rally. Instead of assuming the market is due to roll over, it’s been more productive to track price action and watch for potential changes along the way. So far, drawdowns have been minimal, and breakouts keep occurring. Nothing in the price action hints at a lasting change — yet.

While some are calling this rally “historic,” we have a recent precedent. Recall that from late 2023 through early 2024, the index had a strong start and gave way to a consistent, steady trend.

From late October 2023 through March 2024, the S&P 500 logged seven consecutive trading box breakouts. That streak finally paused with a pullback from late March to early April, which, as we now know, was only a temporary hiccup. Once the bid returned, the S&P 500 went right back to carving new boxes and climbing higher.

New 52-Week Highs Finally Picking Up

If there’s been one gripe about this rally, it’s that the number of new highs within the index has lagged. As we’ve discussed before, among all the internal breadth indicators available, new highs almost always lag — that’s normal. What we really want to see is whether the number of new highs begins to exceed prior peaks as the market continues to rise, which it has, as shown by the blue line in the chart below.

As of Wednesday’s close, 100 S&P 500 stocks were either at new 52-week highs or within 3% of them. That’s a strong base. We expect this number to continue rising as the market climbs, especially if positive earnings reactions persist across sectors.

Even when we get that first day with 100+ S&P 500 stocks making new 52-week highs, though, it might not be the best time to initiate new longs.

The above chart shows that much needs to align for that many stocks to peak in unison, which has historically led to at least a short-term consolidation, if not deeper pullbacks — as highlighted in yellow. Every time is different, of course, but this is something to keep an eye on in the coming weeks.

Trend Check: GoNoGo Still “Go”

The GoNoGo Trend remains in bullish mode, with the recent countertrend signals having yet to trigger a greater pullback.

Active Bullish Patterns

We still have two live bullish upside targets of 6,555 and 6,745, which could be with us for a while going forward. For the S&P 500 to get there, it will need to form new, smaller versions of the trading boxes.

Failed Bearish Patterns

In the chart below, you can view a rising wedge pattern on the recent price action, the third since April. The prior two wedges broke down briefly and did not lead to a major downturn. The largest pullbacks in each case occurred after the S&P 500 dipped below the lower trendline of the pattern.

The deepest drawdown so far is 3.5%, which is not exactly a game-changer. Without downside follow-through, a classic bearish pattern simply can’t be formed, let alone be broken down from.

We’ll continue to monitor these formations as they develop because, at some point, that will change.

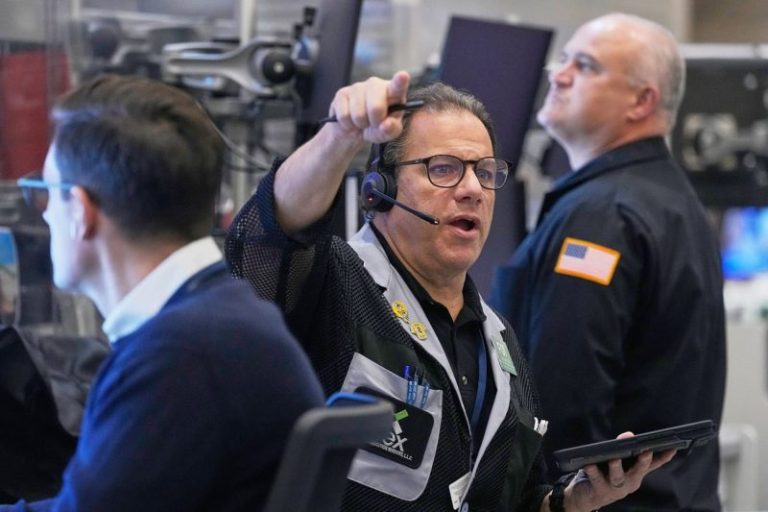
What began as a banner day for stocks turned into a major rout, as investors signaled ongoing skepticism about the longevity of the artificial intelligence boom and trimmed hopes of support from the Federal Reserve.

The tech-heavy Nasdaq fell 2%, and the broad S&P 500 index dropped by more than 1.5%. The Dow Jones Industrial Average, which tracks 30 top-tier stocks, declined by nearly 390 points. It had been up 700 points earlier in the day. Cryptocurrencies also shed billions in value: Bitcoin had fallen below $87,000 as of late Thursday afternoon, weeks after having set highs above $120,000.

The stunning turnaround added further unease to an already shaky economy that has forced households to trim budgets amid stubborn inflation and signs of a wavering job market. With an ever-increasing part of the economy’s principal driver — consumer spending — now reliant on affluent households, an extended market pullback could inflict wider damage.

‘You don’t have to have the biggest bubble in history for an expensive stock market’ and end up seeing declines, said Matt Maley, chief market strategist at Miller Tabak asset management group.

Traders’ hopes were boosted early Thursday by a better-than-expected jobs report that appeared to show the economy remained resilient. Even before the day began, stocks looked poised to rise after Nvidia, the chipmaker at the heart of the AI boom, reported strong quarterly earnings and revenue.

Yet by midday, markets had turned red. The solid September jobs report diminished the odds that the Federal Reserve will cut interest rates next month to lower the cost of borrowing money to spur economic activity. When investors don’t have to pay as much in interest, they often put those savings into stocks.

“The broad rebound in payrolls suggests diminished risks of a higher unemployment rate,” analysts with Morgan Stanley said in a note published shortly before noon. “We no longer expect a Fed cut in December.”

Losses were further compounded by ongoing concerns about AI — specifically, how much more profitable the companies buying chips like Nvidia’s will be. The fears were articulated Wednesday evening on X by Michael Burry, made famous by the movie ‘The Big Short.’

‘Just because something is used does not mean it is profitable,’ he wrote.

Finally, the ongoing sell-off of bitcoin indicated to some traders that a key source of support for stocks — retail or day traders — were beginning to waver on their trademark ‘buy the dip’ mentality.

‘I wouldn’t say we’ve flipped from bull to bear,’ said Steve Sosnick, chief strategist at Interactive Brokers financial group. ‘I would say we’ve flipped from bull to balanced market in the short term. A lot depends on whether sentiment continues to weaken.’

Stocks had already been showing signs of flagging in recent weeks. With Thursday’s losses, the S&P 500 fell to its lowest point since September.

The long-delayed September jobs report, which showed that the United States added a sturdy 119,000 jobs, appeared to show some glimmers of hope for the economy.

Although the unemployment rate ticked up from 4.3% in August to 4.4%, about 450,000 workers entered the labor force. Economists view that as evidence that job opportunities are still plentiful, despite a wave of corporate layoffs.

Just before the Bureau of Labor Statistics released the jobs report, Verizon told employees it planned to lay off 13,000 employees, or about 13% of its workforce.

The company joined a suite of other blue-chip employers that say they plan to eliminate tens of thousands of jobs, including Amazon, General Motors, IBM, Microsoft, Paramount, Target and UPS.

The details of the jobs report, which captured conditions before the government shutdown, as well more recent jobs data, suggested a more mixed picture for the U.S. economy.

Manufacturing shed 6,000 jobs, continuing a trend in a sector the Trump administration has touted as a key target of its economic policies. Transportation and warehousing also lost 25,300 jobs. Wage growth slowed, and job totals for July and August were revised downward.

The employment gains in September were concentrated in the health care, hospitality and social assistance sectors.

Another snapshot of the economy came courtesy of Walmart, which on Thursday reported strong sales and raised its outlook for the year. That strength points to cracks in the economy, though. Executives said the chain is luring more high-income shoppers who are looking for bargains, and noted that lower-income families are feeling more pressure.

‘As pocketbooks have been stretched, you’re seeing more consumer dollars go to necessities versus discretionary items,’ Chief Financial Officer John David Rainey said on an earnings call Thursday morning.

Walmart’s stock closed 6.5% higher.

This post appeared first on NBC NEWS

Markets don’t usually hit record highs, risk falling into bearish territory, and spring back to new highs within six months. But that’s what happened in 2025.

In this special mid-year recap, Grayson Roze sits down with David Keller, CMT, to show how disciplined routines, price-based signals, and a calm process helped them ride the whipsaw instead of getting tossed by it. You’ll see what really happened under the surface, how investor psychology drove the swings, and the exact StockCharts tools they leaned on to stay objective. 

If you’re focused on protecting capital, generating income, and sleeping well at night while still capturing the upside, this is a must-watch. Discover which charts deserve your attention now, what to ignore, and how to prep for the back half of 2025. 

This video premiered on July 23, 2025. Click on the above image to watch on our dedicated Grayson Roze page on StockCharts TV.

You can view previously recorded videos from Grayson at this link.