Author

admin

Browsing

The S&P 500 ($SPX) just logged its fifth straight trading box breakout, which means that, of the five trading ranges the index has experienced since the April lows, all have been resolved to the upside.

How much longer can this last? That’s been the biggest question since the massive April 9 rally. Instead of assuming the market is due to roll over, it’s been more productive to track price action and watch for potential changes along the way. So far, drawdowns have been minimal, and breakouts keep occurring. Nothing in the price action hints at a lasting change — yet.

While some are calling this rally “historic,” we have a recent precedent. Recall that from late 2023 through early 2024, the index had a strong start and gave way to a consistent, steady trend.

From late October 2023 through March 2024, the S&P 500 logged seven consecutive trading box breakouts. That streak finally paused with a pullback from late March to early April, which, as we now know, was only a temporary hiccup. Once the bid returned, the S&P 500 went right back to carving new boxes and climbing higher.

New 52-Week Highs Finally Picking Up

If there’s been one gripe about this rally, it’s that the number of new highs within the index has lagged. As we’ve discussed before, among all the internal breadth indicators available, new highs almost always lag — that’s normal. What we really want to see is whether the number of new highs begins to exceed prior peaks as the market continues to rise, which it has, as shown by the blue line in the chart below.

As of Wednesday’s close, 100 S&P 500 stocks were either at new 52-week highs or within 3% of them. That’s a strong base. We expect this number to continue rising as the market climbs, especially if positive earnings reactions persist across sectors.

Even when we get that first day with 100+ S&P 500 stocks making new 52-week highs, though, it might not be the best time to initiate new longs.

The above chart shows that much needs to align for that many stocks to peak in unison, which has historically led to at least a short-term consolidation, if not deeper pullbacks — as highlighted in yellow. Every time is different, of course, but this is something to keep an eye on in the coming weeks.

Trend Check: GoNoGo Still “Go”

The GoNoGo Trend remains in bullish mode, with the recent countertrend signals having yet to trigger a greater pullback.

Active Bullish Patterns

We still have two live bullish upside targets of 6,555 and 6,745, which could be with us for a while going forward. For the S&P 500 to get there, it will need to form new, smaller versions of the trading boxes.

Failed Bearish Patterns

In the chart below, you can view a rising wedge pattern on the recent price action, the third since April. The prior two wedges broke down briefly and did not lead to a major downturn. The largest pullbacks in each case occurred after the S&P 500 dipped below the lower trendline of the pattern.

The deepest drawdown so far is 3.5%, which is not exactly a game-changer. Without downside follow-through, a classic bearish pattern simply can’t be formed, let alone be broken down from.

We’ll continue to monitor these formations as they develop because, at some point, that will change.

Jaime Carrasco, senior portfolio manager and senior financial advisor at Harbourfront Wealth Management, shares his outlook for gold and silver, saying prices must rise much higher.

He also talks about how to build a strong precious metals portfolio.

‘We’re moving from a credit-based economy, a bubble that is blowing up, to a resource-based economy — and that’s very healthy going forward,’ Carrasco said.

Securities Disclosure: I, Charlotte McLeod, hold no direct investment interest in any company mentioned in this article.

This post appeared first on investingnews.com

After-tax NPV(8%) of $473M (US$346.6M) and 2.2-year payback from start of production with IRR of 48.8% at US$1,000/mtu WO3

Key Highlights:

  • Additional Payback Metrics: Payback1 of approximately 2.2 years from commencement of commercial production corresponding to approximately 4.2 years from start of construction under the medium / US$1,000/mtu WO₃2 case.

  • Capital Efficient Development: Initial capital cost3 of approximately $124.2 million (USD $91 million), with a compact infrastructure layout designed to support efficient underground mining and processing operations.

  • Strong Annual Cash Flow Generation: Average annual revenue of approximately $252,517 million (US$184,886 million), average annual EBITDA of approximately $142,181 million (US$104,101 million), and average annual free cash flow of approximately $96,279 million (US$70,493 million) over the initial mine plan at US$1,000/mtu WO₃.4

  • Integrated Infrastructure Design: Project infrastructure includes planned hydro electric power connection, water supply and recycling systems, road access, and paste backfill integration to support operations while minimizing environmental footprint.

  • Significant Upside Leverage: After-tax IRR of 78.4% and NPV(8%) of $963.8 million (USD $706.4 million) at USD $1,500/mtu WO₃.

  • Resource Growth Underway: Fully funded 20,000-metre drill program continues to target resource expansion, confidence conversion and potential mine life extension beyond the initial 11-year production plan, targeting resource expansion and confidence conversion.

All amounts in Canadian dollars unless stated otherwise.4

Vancouver, British Columbia–(Newsfile Corp. – March 9, 2026) – Allied Critical Metals Inc. (CSE: ACM,OTC:ACMIF) (OTCQB: ACMIF) (FSE: 0VJ0) (‘Allied‘ or the ‘Company‘) is pleased to provide additional economic and technical detail from the recently announced Preliminary Economic Assessment (‘PEA’) for its 100%-owned Borralha Tungsten Project (‘Borralha’ or the ‘Project’) in northern Portugal. The Project’s previously announced PEA economics remain unchanged.

Roy Bonnell, CEO & Director of Allied, commented: ‘Following the release of our initial Borralha PEA, we received strong investor interest in additional project-level detail. This supplementary disclosure highlights the Project’s capital efficiency, strong annual cash generation and well-developed infrastructure platform. Importantly, the underlying economics of the PEA remain unchanged, while the additional payback presentation provides another useful reference point for investors evaluating project returns and the strong leverage Borralha has to tungsten prices.’

This additional disclosure provides greater clarity on Borralha’s capital efficiency, expected cash flow generation and rapid capital recovery profile. The Borralha PEA outlines a capital-efficient underground tungsten development project within the European Union, demonstrating strong economic returns across a range of tungsten price assumptions and significant leverage to current market prices.

The Borralha PEA continues to demonstrate a technically robust and capital-efficient underground tungsten development project within the European Union. As previously announced, the PEA was evaluated under three pricing frameworks: the Base case of $962/mtu WO₃ (US$704/mtu WO₃), $1,365/mtu WO₃ (US$1,000/mtu WO₃), and $2,049/mtu WO₃ (US$1,500/mtu WO₃), while mine design and cut-off grade selection were developed using a conservative tungsten price assumption of $900/mtu WO₃ (US$659/mtu WO₃). The Company is providing the additional metrics below to facilitate investor understanding of project capital intensity, cash flow generation and payback presentation.

For additional reference, the Company is presenting payback under two different measurement bases. The previously disclosed payback metrics were measured from the start of construction (SC), consistent with standard technical study practice. To facilitate comparison with industry benchmarks, the Company is also providing indicative payback measured from the commencement of commercial production (CCP).

Table 1 – Economic Results (After-Tax)

Scenario Price1 NPV (8%)2 IRR3 Payback SC4 Payback CCP4
Medium $1,365/mtu
(USD $1,000/mtu)
$473.4M
(USD $346.6M)
48.8% 2.2 years 4.2 years
Base $962/mtu
(USD $704/mtu)
$182.7M
(USD $134.0M)
27.2% 3.8 years 5.8 years
High $2,049/mtu
(USD $1,500/mtu)
$963.8M
(USD $706.4M)
78.4% 1.2 years 3.2 years

 
Notes:

  1. NPV is a Non-GAAP measure; see notes below for additional information regarding NPV. M = million.
  2. IRR is a Non-GAAP measure; see notes below for additional information regarding IRR.
  3. Payback is a Non-GAAP measure. see notes below for additional information regarding payback.

Payback measured from the start of construction reflects recovery of initial capital over the full development and operating timeline, while payback measured from the start of commercial production excludes the construction phase and is presented for comparative reference only.

The results highlight significant sensitivity to tungsten price while maintaining positive economics under conservative long-term assumptions.

In the Base Case scenario, tungsten (WO₃) represents approximately 96% of project NPV, with minor contributions from copper (~3%) and tin (<1%), based on NSR contribution. This highlights that the Borralha Project economics are overwhelmingly driven by tungsten.

For reference, current reported tungsten market prices remain materially above the US$1,000 per mtu sensitivity case presented in the PEA, reaching approximately $2,998 per mtu (US$2,195 per mtu) as of March 6, 2026 (Source: Fastmarkets).

Mineral Resource Estimate

This initial PEA is based on the updated Mineral Resource Estimate (‘MRE’ or ‘2025 MRE’) for the Santa Helena Breccia, which were presented in accordance with National Instrument 43-101 – Standards of Disclosure for Mineral Projects (‘NI 43-101’) in the Company’s current technical report on Borralha (the ‘Technical Report’) entitled ‘Technical Report on the Borralha Property, Parish of Salto, District of Vila Real, Portugal’, dated effective December 30, 2025, which is published on the Company’s website at www.alliedcritical.com and under its profile on SEDAR+ at www.sedarplus.ca.

Under the 2025 MRE, the Santa Helena Breccia has been tested by 41 drill holes and surface trenching over approximately 400 meters of strike length and to depths exceeding 350 meters below surface. Mineralization remains open along strike and at depth. The cut-off grade of 0.09% WO3was selected based on reasonable prospects for eventual economic extraction under conceptual underground mining and gravity-dominant processing assumptions, including a very conservative tungsten price of USD$ 550/mtu WO₃ and assumed recovery of approximately 80% (for MRE cut-off determination only).

Table 2 -2025 MRE for Borralha (see also Technical Report for further details)

Clasification Tonnes (Mt) Grade (% WO3)
Measured + Indicated 13.0 0.21
Inferred 7.7 0.18


Initial Capital Allocation and Operational Costs

The Borralha PEA estimates initial capital7 of approximately US$91 million, with sustaining capital8 of approximately US$87 million and total life-of-mine capital9 of approximately US$178 million. The initial capital requirement reflects a compact project design integrating underground mine development, process plant construction and site infrastructure.

Table 3 – Initial Capital Costs

Category CAD$M* US$M
Underground development 21.6 15.8
Processing plant 23.1 16.9
Paste backfill plant 5.9 4.3
Surface infrastructure 6.7 4.9
Power connection 9.8 7.2
EPCM / indirect costs** 16.4 12.0
Contingency 6.0 4.4
Tax incentives 34.3 25.1
Subtotal Initial Capital 123.7 91.5

 
*Canadian dollar (CAD) equivalents calculated used a foreign exchange rate of CAD $1.3658/USD.
**EPCM = Engineering, Procurement, and Construction Management.

Certain development expenditures may also qualify for applicable Portuguese investment tax incentives, which could partially offset initial capital expenditures.

Table 4 – Operating Cost10 Breakdown

Cost Category US$/t Processed
Mining 41.2
Processing 13.2
G&A 5.0
Transport 0.02
TC/RC* 0.51
Total Operating Cost** 59.3

 
*TC/RC = Treatment Changes and Refining Charges. These are fees paid by mining companies to smelters to process raw material concentrate into refined metal.
**Operating costs for life-of-mine used for mine design average approximately US$49/t processed, based on the Sub-Level Long Hole Stoping (SLOS) mining method. Limited areas may utilize Drift & Fill mining, which carries higher unit costs. In the economic model, operating costs are expressed in nominal US dollars and escalated annually for inflation, resulting in an average life of mine operating cost of approximately US$59/t processed, including transportation and treatment/refining charges.

Concentrate Marketing Assumptions

The PEA assumes production of a marketable tungsten concentrate grading approximately 65% WO₃ using a gravity-dominant flowsheet. Concentrate pricing assumptions are based on industry-standard tungsten concentrate marketing structures, incorporating typical 80% payability terms and treatment charges applicable to the tungsten market.

The Project benefits from relatively clean mineralogy dominated by wolframite, which generally reduces impurity-related penalties relative to more complex tungsten concentrates.

Capital Efficiency

The relatively modest initial capital requirement reflects several favourable project characteristics, including:

  • compact underground mining footprint
  • gravity-dominant processing flowsheet
  • access to regional infrastructure including grid power
  • limited earthworks due to site topography
  • moderate plant throughput of 1.4 million tonnes per annum (Mtpa) of mineralized material
  • potential Portuguese investment incentives

These factors contribute to a capital-efficient development scenario compared with many global tungsten projects.

Simplified Annual Cash Flow Metrics

The initial Borralha mine plan is expected to generate strong annual cash flow11 supported by life-of-mine average production of approximately 1,708 tonnes WO₃ per annum, a nominal processing rate of 1.4 Mtpa, and an average mill feed grade of approximately 0.20% WO₃.

Table 5 – Cash-Flow11 Table

Cash Flow Metric Base Case
US$704/mtu WO₃
Medium Case
US$1,000/mtu WO₃
High Case
US$1,500/mtu WO₃
Average annual revenue 131,749 184,886 274,686
Average annual EBITDA 53,374 104,101 189,860
Average annual pre-tax operating cash flow 40,405 91,132 176,890
Average annual free cash flow 35,815 70,493 128,785
Life-of-mine revenue 1,449,234 2,033,747 3,021,554
Life-of-mine free cash flow 393,973 775,428 1,416,640


Infrastructure and Site Requirements

The Borralha Project benefits from favourable site conditions and access to existing regional infrastructure, supporting a capital-efficient development.

Surface infrastructure has been designed to concentrate industrial and administrative facilities within a compact footprint, minimizing environmental disturbance while ensuring operational efficiency. The process plant, paste backfill facility, workshops, administrative buildings and support infrastructure will be located on a centralized platform adjacent to the orebody.

Access to the site will utilize existing regional roads connected to the municipal road CM1025-2. Dedicated routes for light and heavy vehicles have been designed to ensure safe operations while minimizing earthworks and environmental impact.

A comprehensive water management system has been designed to support mining and processing operations. Water supply is expected to be sourced from local groundwater and surface water resources, with water recycling integrated into the process flowsheet. Three retention basins will provide operational water storage, sedimentation and environmental control.

Electrical power will be supplied through connection to the Portuguese national grid via a planned 60 kV overhead line linking the Borralha substation to the SE Frades (REN) substation over approximately 6.5 km. The design complies with applicable national standards and incorporates environmental protection measures.

The project infrastructure design integrates processing, backfill, water management and power supply systems to support efficient underground mining operations while minimizing environmental impact.

Key Infrastructure Advantages

  • Grid power connection (60 kV line – 6.5 km)
  • Local groundwater and surface water available for operations
  • Existing regional road access to site
  • Compact site layout minimizing environmental footprint
  • Paste backfill and water recycling integrated into plant design

Ongoing Growth Strategy

The current initial PEA is based only on the Santa Helena Breccia deposit and an initial 11-year production plan. The Company’s fully funded 20,000-metre drill program is underway and is targeting:

  • expansion of the current Mineral Resource;
  • conversion of Inferred Mineral Resources into higher-confidence categories;
  • potential extension of mine life beyond the initial plan; and
  • evaluation of throughput optimization and future project scale growth.

The Company intends to continue advancing Borralha through additional drilling, engineering optimization, metallurgical refinement, geotechnical and hydrogeological studies, and progression toward the next stage of technical study.

Qualified Persons

The scientific and technical information contained in this news release has been reviewed and approved by the following Qualified Persons, as defined under NI 43-101:

J. Douglas Blanchflower, P.Geo.

Mr. Blanchflower is an independent Qualified Person under NI 43-101 and was retained by Allied Critical Metals Inc. to prepare the NI 43-101 Technical Report dated effective December 30, 2025. He has overall responsibility for the 2025 MRE and the Technical Report. Mr. Blanchflower is a Registered Professional Geoscientist in good standing with the Association of Professional Engineers and Geoscientists of British Columbia (No. 19086) and has more than five decades of experience in mineral exploration, resource estimation, and technical reporting. Mr. Blanchflower has reviewed and approved the scientific and technical information in this news release relating to the mineral resource estimate.

David Castro López, BSc, MIMMM, QMR

Mr. Castro López is a Mining Engineer and a Professional Member (MIMMM #685484) and Qualified for Minerals Reporting (QMR) of the Institute of Materials, Minerals and Mining (IOM3). He is independent of the Company and the Borralha Project. Mr. Castro López contributed to the metallurgical review and process design considerations supporting the PEA and takes responsibility for the metallurgical and mineral processing information contained herein. Mr. López has reviewed and approved the scientific and technical information in this news release relating to the metallurgical and mineral processing information contained herein.

Miguel Cabal, EurGeol, Licensed Geologist

Mr. Cabal is a licensed geologist with the European Federation of Geologists (EuroGeol #1439) with over 28 years of experience in mineral exploration, resource evaluation and mine development. He is Managing Director of Geomates (Spain) and has contributed to multiple NI 43-101 and JORC-compliant technical reports, including PEA, PFS and feasibility studies. Mr. Cabal is independent of Allied Critical Metals Inc. and the Borralha Project and has reviewed and approved the mining and economic components of the PEA. Mr. Cabal has reviewed and approved the scientific and technical information in this news release relating to the mining and economic components of this news release.

Vítor Arezes, BSc, MIMMM, QMR

Mr. Arezes is Vice President Exploration of Allied Critical Metals Inc. and a Qualified Person under NI 43-101. He is not independent of the Company due to his role as an officer. Mr. Arezes has extensive experience in tungsten and polymetallic mineral systems and has conducted multiple site visits to the Borralha Project, including during the 2025 drilling campaign. He contributed to geological interpretation, exploration oversight, and technical review supporting the PEA. He is a member of the Institute of Materials, Minerals and Mining (MIMMM #703197) and a Qualified Mineral Resources and Ore Reserves Professional (QMR), and by reason of education, professional experience, and accreditation, meets the definition of a Qualified Person as defined in NI 43-101. Mr. Arezes has reviewed and approved all of the scientific and technical information in this news release.

About Allied Critical Metals Inc.

Allied Critical Metals Inc. is a Canadian-based mining company focused on the advancement and revitalization of its 100%-owned Borralha Tungsten Project and the Vila Verde Tungsten Project in northern Portugal.

The Borralha Project is one of the largest undeveloped tungsten resources within the European Union and benefits from a favourable Environmental Impact Declaration (DIA), positioning the Project for advancement toward feasibility and development. Vila Verde represents additional exploration upside within the same strategic jurisdiction.

Tungsten has been designated a critical raw material by the United States and the European Union due to its strategic importance in defense, aerospace, manufacturing, automotive, electronics and energy applications. Currently, China, Russia and North Korea account for approximately 87% of global tungsten supply and reserves, highlighting the importance of secure western sources.

Further details regarding the Borralha Project are available in the Company’s NI 43-101 Technical Report dated December 30, 2025, filed on SEDAR+ at www.sedarplus.ca and on the Company’s website at www.alliedcritical.com.

ON BEHALF OF THE BOARD OF DIRECTORS

‘Roy Bonnell’
CEO and Director

Additional information is also available by contacting the Company:

Dave Burwell
Vice President, Corporate Development
daveb@alliedcritical.com
Tel:403-410-7907
Toll Free: 1-800-221-0915

Please also visit our website at www.alliedcritical.com.

Also visit us at:
LinkedIn: https://www.linkedin.com/company/allied-critical-metals-inc/
X: https://x.com/@alliedcritical/
Facebook: https://www.facebook.com/alliedcriticalmetals/
Instagram: https://www.instagram.com/alliedcriticalmetals/

The Canadian Securities Exchange does not accept responsibility for the adequacy or accuracy of this release.

Cautionary Statement Regarding Forward-Looking Information

This news release contains ‘forward-looking information’ within the meaning of applicable Canadian securities laws (‘FLI‘). FLI in this release includes, without limitation, statements regarding: (A) the PEA results and economic indicators (e.g., NPV, IRR, payback and related sensitivities); (B) the conceptual mine plan and operating framework (mining approach, processing rates, production profiles, cost ranges and schedules); (C) the technical basis and process assumptions (cut-off approach, flowsheet concept and anticipated concentrate specifications); (D) the status and trajectory of permitting and approvals, infrastructure access and other site requirements; (E) market-related assumptions and the Project’s sensitivity and leverage to commodity pricing; (F) growth, conversion and expansion opportunities, including planned drilling and other technical programs; (G) the anticipated sequence of future studies, potential financing pathways and indicative timelines; and (H) the Project’s strategic positioning relative to regional and policy objectives. Such FLI is identified by, among other things, words such as ‘plans’, ‘expects’, ‘is expected’, ‘aims’, ‘budget’, ‘scheduled’, ‘estimates’, ‘forecasts’, ‘intends’, ‘anticipates’, ‘potential’, ‘target’, ‘opportunity’, ‘may’, ‘could’, ‘would’, ‘might’, ‘will’ and similar terminology, as well as statements regarding outcomes that ‘will’, ‘should’ or ‘would’ occur.

Material assumptions underlying the FLI include, but are not limited to: the accuracy of the 2025 MRE; geological continuity; the PEA-level capital/operating cost estimates (with typical PEA accuracy ranges); metallurgical recoveries and process performance consistent with test results to date; availability of labour, equipment and consumables at quoted/priced levels; access to grid power and water on contemplated terms; the ability to obtain land access, permits and approvals (including RECAPE) in a timely manner; tungsten pricing consistent with Argus long-term forecasts or stated sensitivity cases; foreign exchange and inflation consistent with study inputs; and availability of financing on acceptable terms. The Company believes these assumptions are reasonable as of the date hereof, but no assurance can be given that they will prove correct.

The PEA is preliminary in nature and includes Inferred Mineral Resources that are considered too speculative geologically to have the economic considerations applied to them that would enable them to be categorized as Mineral Reserves. There is no certainty that the PEA results will be realized. Mineral Resources are not Mineral Reserves and do not have demonstrated economic viability. Any reference to potential production, mine life, NPV, IRR, payback, costs, recoveries, or other economic or technical parameters is preliminary and conceptual.

Key risks and uncertainties that could cause actual results to differ materially from those expressed or implied by the FLI include, but are not limited to: (i) exploration, geological, modelling and grade-continuity risks, including the risk that further work does not confirm Inferred material or resource extensions; (ii) risks that metallurgical performance, WO₃ recoveries, concentrate quality or processing costs differ from test work and assumptions; (iii) capital cost escalation, schedule delays, contractor availability and supply-chain constraints; (iv) operating cost inflation (power, reagents, labour, transportation); (v) commodity price and FX volatility (including sustained periods below the Argus long-term or sensitivity prices assumed); (vi) permitting, environmental, social, community, land access and regulatory risks in Portugal (including RECAPE outcomes and permit conditions); (vii) water, tailings and geotechnical/hydrogeological risks inherent in underground operations; (viii) offtake, marketing and market-access risks for tungsten concentrates; (ix) availability and cost of equity, debt or project finance on acceptable terms; (x) changes in laws, regulations, taxes, royalties, or government policies; and (xi) other risks described under ‘Business Risks’ in the Company’s most recent MD&A and in other continuous disclosure filings available on SEDAR+. Readers are urged to carefully review those risk factors, which are expressly incorporated by reference into this cautionary note.

Non-GAAP Financial Measures

The Company has included certain non-GAAP financial measures in this press release. These financial measures are not defined under International Financial Reporting Standards (‘IFRS‘) and should not be considered in isolation. The Company believes that these financial measures, together with financial measures determined in accordance with IFRS, provide investors with an improved ability to evaluate the underlying performance of the Company. The inclusion of these financial measures is meant to provide additional information and should not be used as a substitute for performance measures prepared in accordance with IFRS. These financial measures are not necessarily standard and therefore may not be comparable to other issuers.

Net Present Value (NPV) – is the present value calculation of net profit from operations determined using a particular discount rate. All NPV values stated herein are on an after tax basis.

Internal Rate of Return (IRR) – is a financial metric used to assess an investment’s profitability by calculating the annual rate of return that makes the NPV of all cash flows (both positive and negative) equal to zero.

Payback – is calculated in years as the length of time that it takes to pay off the capital costs from annual net profit expected from operations at the Borralha Project.

Initial capital – is the initial capital cost amount required to be expended to construct the mine and tungsten concentrator process equipment and buildings to begin processing mineralized material into saleable tungsten concentrate at commercial quantities according to the life of mine plan at the Borralha Project. Table 3 above provides a breakdown of the initial capital costs. This is an estimate accurate to +/-35%.

Sustaining capital – is a supplementary financial measure which reflects cash basis expenditures which are expected to maintain operations and sustain production levels at the Borralha Project.

Capital costs or Total life of mine capital costs – include the Initial capital and the sustaining capital.

Operating costs – are the costs required to process mineralized material into saleable tungsten concentrate at the Borralha Project. This includes: underground mining; processing and plant operations; general and administrative costs; and site services and infrastructure support (see Table 4 above for a breakdown of the operating costs). This can be calculated on the unit basis per mtu WO3 produced.

Cash flow – includes average annual revenue, average annual EBITDA (earnings before interest, taxes, depreciation and amortization), average annual pre-tax cash flow, average annual free cash flow, life of mine revenue, life of mine free cash flow. Average annual revenue is the average annual gross revenue over the life of mine. Average annual EBITDA is the average annual EBITDA over the life of mine. Average annual pre-tax cash flow is the average over the life of mine of the annual free cash flow prior to deduction of taxes. Life of mine revenue is the total gross revenue over the life of mine. Life of mine free cash flow is the total free cash flow over the life of mine. Free cash flows are revenues net of operating costs, royalties, working capital adjustments, capital expenditures and cash taxes. The Company believes that this measure is useful to readers in assessing the Company’s ability to generate cash flows from Borralha.

All-In Sustaining Costs (AISC) – are comprised of sustaining capital expenditures and site level costs to support ongoing operations and closure costs. All-in sustaining costs per mtu WO3 is calculated as AISC divided by the amount of mtu WO3 produced during the period that the costs are incurred. All-in sustaining costs capture the important components of the Company’s production and related costs and are used by the Company and investors to understand projected cost performance at the Borralha Project. Adoption of the all-in sustaining cost metric is voluntary and not necessarily standard, and therefore, this measure presented by the Company may not be comparable to similar measures presented by other issuers. The Company believes that the all-in sustaining cost measure complements existing measures and ratios reported by the Company. All-in sustaining cost includes both operating and capital costs required to sustain WO3 production on an ongoing basis. Sustaining operating costs represents expenditures expected to be incurred at the Project that are considered necessary to maintain production. Sustaining capital represents expected capital expenditures comprising mine development costs, including capitalized waste, and ongoing replacement of mine equipment and other capital facilities, and does not include expected capital expenditures for major growth projects or enhancement capital for significant infrastructure improvements.

1 Payback is a Non-GAAP measure. See notes below for additional information regarding payback.
2 mtu/WO3 = metric tonne unit of tungsten; WO3 is tungsten trioxide.
3 Initial capital cost is a Non-GAAP measure. See Table 3 below for a breakdown of the costs and the notes below for additional information regarding initial capital cost.
4 Average annual revenue, average annual EBITDA, and average annual free cash flow are Non-GAAP measures. See notes below for additional information.
5 NPV(8%) = net present value at a 8% discount rate. NPV is a Non-GAAP measure; see notes below for additional information regarding NPV. USD = United States dollars. Canadian dollar (CAD) equivalents calculated used a foreign exchange rate of CAD $1.3658/USD.
6 IRR = internal rate of return. IRR is a Non-GAAP measure; see notes below for additional information regarding IRR.
7 Initial capital cost is a Non-GAAP measure. See Table 3 above for a breakdown of the costs and the notes below for additional information regarding initial capital cost.
8 Sustaining capital is a Non-GAAP measure. See notes below for additional information regarding sustaining capital.
9 Total life of mine capital cost is a Non-GAAP measure. See notes below for additional information regarding total life of mine capital cost.
10 Operating cost is a Non-GAAP measure. See Table 4 for a breakdown of the Operating Costs and the notes below for additional information regarding Operating Cost.
11 Cash flow is a Non-GAAP measure. See Table 5 for a breakdown of the cash flow and the notes below for additional information regarding cash flow.

To view the source version of this press release, please visit https://www.newsfilecorp.com/release/287858


News Provided by TMX Newsfile via QuoteMedia

This post appeared first on investingnews.com

U.S. stock markets were poised for lift off Thursday, after a strong earnings report from computer chip giant Nvidia signaled that there is still plenty of room to run in the artificial intelligence boom that has powered markets higher for much of the year.

Prior to the opening bell, bets on the S&P 500 were up about 1%, while the tech-heavy Nasdaq climbed 1.5%.

Late Wednesday, Nvidia said sales of its trademark Blackwell AI chips ‘are off the charts,’ while another set of key computer processing units is ‘sold out,” founder and CEO Jensen Huang said in a statement.

On a call with investors following the report, Huang dismissed concerns about an AI bubble.

“There’s been a lot of talk about an AI bubble. From our vantage point, we see something very different,” Huang said.

Dan Ives, managing director at Wedbush Securities finanical group, echoed that sentiment.

“This was a golden quarter for Nvidia with demand massive and well above Street whisper numbers,’ Ives said in an email. ‘These numbers validate the AI Revolution is still early days and send the bears back into hibernation mode.’

Shares of the world’s most valuable company were up more than 4% in after-hours trading.

Nvidia’s chips have been the catalysts for a massive build-out of data centers that have supplied a backbone to the U.S. economy amid slowdowns elsewhere. More money is flowing into building data centers than all other manufacturing facility types combined, according to the research group S&P Global.

Until recently, that spending has also powered major stock indexes to record highs.

Lately, however, stocks have shown signs of wobbling lately. The declines in share prices — led by tech companies — have sparked debates about whether AI-driven gains are beginning to slow.

This raises a bigger question: how the broader economy will perform if it no longer benefits from all the wealth the AI boom is creating.

Nvidia’s latest earnings are likely to allay these fears, for now at least.

Huang said last month that his company had $500 billion in orders for its chips, for 2025 and 2026 combined.

“This is how much business is on the books. Half a trillion dollars’ worth so far,” Huang said at a conference in Washington, D.C.

Alongside broader concerns about the state of the U.S. economy, stock market momentum has been tripped up by worries about circular dealing among AI’s biggest players. This means the same money is being passed back and forth between several companies — even as each company’s individual value climbs.

Nvidia is a fixture in the kinds of deals that are raising concerns. It recently announced a commitment alongside Microsoft to fund AI software provider Anthropic with $10 billion.

Nvidia CEO Jensen Huang during the Live Keynote Pregame of the Nvidia GPU Technology Conference in Washington on Oct. 28.Jim Watson / AFP – Getty Images file

This kind of big collaboration news would typically boost the stock prices of all the companies involved. But neither Nvidia’s nor Microsoft’s stock got a boost from the Anthropic announcement.

Analysts with Deutsche Bank said this is a sign of the ongoing investor wariness about deals like this.

“It goes to show how sentiment has turned more negative in the last few weeks, with the circular AI deals being treated with increasing caution as the conversation around a potential bubble has gathered pace,” they wrote in a note published Wednesday.

The Nvidia headquarters, in Santa Clara, Calif., on May 21, 2024.Justin Sullivan / Getty Images file

The question now is whether the latest market hiccups represent a temporary pullback, or the onset of a more permanent state of affairs.

For the experts who are cautiously optimistic that the market will continue to climb, Nvidia’s massive haul serves to validate their rosy outlook.

“We think the investment boom has room to run,” Goldman Sachs researchers wrote in a note published Wednesday, adding that the economy writ large has remained resilient, something that should provide ongoing support to stock returns.

This post appeared first on NBC NEWS

More than 1,000 unionized Starbucks workers went on strike at 65 U.S. stores Thursday to protest a lack of progress in labor negotiations with the company.

The strike was intended to disrupt Starbucks’ Red Cup Day, which is typically one of the company’s busiest days of the year. Since 2018, Starbucks has given out free, reusable cups on that day to customers who buy a holiday drink. Starbucks Workers United, the union organizing baristas, said Thursday morning that the strike had already closed some stores and was expected to force more to close later in the day.

Starbucks Workers United said stores in 45 cities would be impacted, including New York, Philadelphia, Minneapolis, San Diego, St. Louis, Dallas, Columbus, Ohio, and Starbucks’ home city of Seattle. There is no date set for the strike to end, and more stores are prepared to join if Starbucks doesn’t reach a contract agreement with the union, organizers said.

Starbucks emphasized that the vast majority of its U.S. stores would be open and operating as usual Thursday. The coffee giant has 10,000 company-owned stores in the U.S., as well as 7,000 licensed locations in places like grocery stores and airports.

As of noon Thursday on the East Coast, Starbucks said it was on track to meet or exceed its sales expectations for the day at its company-owned stores.

“The day is off to an incredible start,” the company said in a statement.

Around 550 company-owned U.S. Starbucks stores are unionized. More have voted to unionize, but Starbucks closed 59 unionized stores in September as part of a larger reorganization campaign.

Here’s what’s behind the strike.

Striking workers say they’re protesting because Starbucks has yet to reach a contract agreement with the union. Starbucks workers first voted to unionize at a store in Buffalo in 2021. In December 2023, Starbucks vowed to finalize an agreement by the end of 2024. But in August of last year, the company ousted Laxman Narasimhan, the CEO who made that promise. The union said progress has stalled under Brian Niccol, the company’s current chairman and CEO. The two sides haven’t been at the bargaining table since April.

Workers say they’re seeking better hours and improved staffing in stores, where they say long customer wait times are routine. They also want higher pay, pointing out that executives like Niccol are making millions and the company spent $81 million in June on a conference in Las Vegas for 14,000 store managers and regional leaders.

Dochi Spoltore, a barista from Pittsburgh, said in a union conference call Thursday that it’s hard for workers to be assigned more than 19 hours per week, which leaves them short of the 20 hours they would need to be eligible for Starbucks’ benefits. Spoltore said she makes $16 per hour.

“I want Starbucks to succeed. My livelihood depends on it,” Spoltore said. “We’re proud of our work, but we’re tired of being treated like we’re disposable.”

The union also wants the company to resolve hundreds of unfair labor practice charges filed by workers, who say the company has fired baristas in retaliation for unionizing and has failed to bargain over changes in policy that workers must enforce, like its decision earlier this year to limit restroom use to paying customers.

Starbucks says it offers the best wage and benefit package in retail, worth an average of $30 per hour. Among the company’s benefits are up to 18 weeks of paid family leave and 100% tuition coverage for a four-year college degree. In a letter to employees last week, Starbucks’ Chief Partner Officer Sara Kelly said the union walked away from the bargaining table in the spring.

Kelly said some of the union’s proposals would significantly alter Starbucks’ operations, such as giving workers the ability to shut down mobile ordering if a store has more than five orders in the queue.

Kelly said Starbucks remained ready to talk and “believes we can move quickly to a reasonable deal.” Kelly also said surveys showed that most employees like working for the company, and its barista turnover rates are half the industry average.

Unionized workers have gone on strike at Starbucks before. In 2022 and 2023, workers walked off the job on Red Cup Day. Last year, a five-day strike ahead of Christmas closed 59 U.S. stores. Each time, Starbucks said the disruption to its operations was minimal. Starbucks Workers United said the new strike is open-ended and could spread to many more unionized locations.

The number of non-union Starbucks locations dwarfs the number of unionized ones. But Todd Vachon, a union expert at the Rutgers School of Management and Labor Relations, said any strike could be highly visible and educate the public on baristas’ concerns.

Unlike manufacturers, Vachon said, retail industries depend on the connection between their employees and their customers. That makes shaming a potentially powerful weapon in the union’s arsenal, he said.

Starbucks’ same-store sales, or sales at locations open at least a year, rose 1% in the July-September period. It was the first time in nearly two years that the company had posted an increase. In his first year at the company, Niccol set new hospitality standards, redesigned stores to be cozier and more welcoming, and adjusted staffing levels to better handle peak hours.

Starbucks also is trying to prioritize in-store orders over mobile ones. Last week, the company’s holiday drink rollout in the U.S. was so successful that it almost immediately sold out of its glass Bearista cup. Starbucks said demand for the cup exceeded its expectations, but it wouldn’t say if the Bearista will return before the holidays are ove

This post appeared first on NBC NEWS

Garrett Goggin, founder of Golden Portfolio, says although gold and silver haven’t gone mainstream yet, the metals — and the mining sector overall — have entered a new era.

‘It’s a real mind shift — it’s a new era in mining right here,’ he said.

Securities Disclosure: I, Charlotte McLeod, hold no direct investment interest in any company mentioned in this article.

This post appeared first on investingnews.com

Walmart announced Friday that longtime CEO Doug McMillon will retire at the end of January — which came as a surprise to some given the company’s success in a rapidly evolving retail landscape.

John Furner, Walmart’s U.S. CEO, will assume the role of overall CEO on Feb. 1, the company said. McMillon will continue to serve in an executive and advisory role through January 2027. Furner, 51, began his career at Walmart as an hourly associate.

McMillon, 59, has held the top job since 2014 and is only the fifth person to lead the storied company in its 63-year history.

McMillon has overseen a radical transformation of Walmart’s image in a little over a decade.

In 2014, Walmart had a reputation as a budget retail option and was accused of underpaying its associates. Today, it draws more well-to-do shoppers and has earned credit for adopting innovative personnel policies.

McMillon also built up Walmart’s e-commerce operation into the country’s second-largest, behind only Amazon. Over the course of McMillon’s tenure, the value of Walmart’s shares has increased some 300%.

“Serving as Walmart’s CEO has been a great honor and I’m thankful to our Board and the Walton family for the opportunity,” McMillon said in a statement. “I’ve worked with John for more than 20 years. … He’s uniquely capable of leading the company through this next AI-driven transformation.”

America’s retail landscape continues to rapidly evolve, as consumer spending habits increasingly bifurcate between wealthier households and everyone else.

However, Walmart’s quarterly results have held steady — and the company has been justly rewarded by investors. Just this year, Walmart shares have climbed around 13%. Over the course of McMillon’s tenure, the retailer’s stock price is up some 300%.

On Walmart’s most recent earnings call in August, McMillon indicated the company has been able to withstand the broader pressures facing consumers. Its shoppers’ “behavior has been generally consistent,” he said. “We aren’t seeing dramatic shifts.”

Other retailers have not been so fortunate.

Target’s shares have lost about one-third of their value this year, as the chain works to regain its footing in a more value-conscious environment. In August, longtime CEO Brian Cornell announced plans to step down.

Amazon, meanwhile, has fared slightly better as consumers continue to prioritize the convenience of online shopping. But it recently announced thousands of layoffs affecting corporate employees. Amazon’s share price has climbed about 8% this year.

McMillon has also steered Walmart through a volatile period in U.S. politics, during which elected officials have engaged directly with companies and consumers have proven willing to boycott corporate giants over social issues.

Walmart found itself in President Donald Trump’s crosshairs in May, after it signaled plans to increase some prices in response to his tariffs.

“Walmart should STOP trying to blame Tariffs as the reason for raising prices throughout the chain,” Trump wrote on his Truth Social platform. “Between Walmart and China they should, as is said, ‘EAT THE TARIFFS,’ and not charge valued customers ANYTHING. I’ll be watching, and so will your customers!!!”

While subsequent reports indicated that Walmart had indeed increased prices on some items, McMillon said in August that the changes were gradual enough that consumer habits shifted only modestly.

Six months after Trump singled Walmart out over tariffs, he did so again — but for a very different reason.

In recent weeks, the Trump White House has repeatedly touted Walmart’s 2025 Thanksgiving menu package — which costs less overall than the retailer’s similar menu did last year — as a sign that the president’s economic policies have helped drive down grocery prices for consumers.

But there is a flaw in that rationale. This year’s Walmart Thanksgiving menu contains fewer items than last year’s menu did.

This post appeared first on NBC NEWS

CALGARY, AB / ACCESS Newswire / March 9, 2026 / Valeura Energy Inc. (TSX:VLE,OTC:VLERF)(OTCQX:VLERF) (‘Valeura’ or the ‘Company’) announces completion of a successful infill drilling campaign at its Gulf of Thailand Manora field (Block G1/48, 70% operated working interest).

Dr. Sean Guest, President and CEO commented:
‘Our Manora drilling campaign illustrates that we can continue adding to the ultimate production potential of our Gulf of Thailand fields. Our approach is to take every opportunity to appraise potential future development locations while developing known reservoir intervals. We have once again delivered new production from the field and also laid the basis for further development in the future.’

Valeura successfully drilled a campaign comprised of two infill development targets and one appraisal well from the Manora A platform. All wells were successful, and notably the appraisal well was found to be optimally positioned for use as a production well. As a result, all three wells have been completed as oil producers and are now on stream. Manora’s oil production has increased from an average of 1,950 bbls/d prior to the first new well coming onstream, to a more recent average of 2,626 bbls/d (working interest share oil production before royalites)(1).

Valeura’s management expects that the newly encountered reservoir intervals will be considered in the next evaluation of reserves and could therefore be additive to the ultimate potential and economic life of the asset.

MNA-41 was drilled as a deviated appraisal well to evaluate the potential of two reservoir intervals. The well encountered oil pay in the 300-series sand reservoir, which will be analysed to identify future prospects in this zone. In addition, the well encountered five oil pay zones in the 400/500-series reservoir. It has been completed as a comingled oil producer and is now on production. Results have exceeded management’s expectations, which sought only to assess the potential for future development of these intervals.

MNA-35ST1 was drilled as a sidetrack to the pre-exisitng MNA-35 well, with the objective of developing the same two reservoir intervals access in MNA-41. Two pay zones were encountered in the 300 sands, which will be completed for production in the future. In the meantime, the well has been completed as a producer of five oil pay zones within the 400/500 reservoir sands and is now on production.

MNA-42H was geo-steered as a horizontal development well within the 300 series sand reservoir. The well’s 1,046 ft lateral section encountered 556′ of net oil pay, which has exceeded management’s expectations. The well has been completed and is now online as a horizontal oil producer.

The Manora drilling campaign was completed safely, on time, and on budget. Valeura’s contracted drilling rig has now been mobilised to the Nong Yao field on block G11/48 (90% operated working interest) where the Company is planning to drill a production-oriented campaign from the Nong Yao A and Nong Yao B wellhead facilities.

(1) 15-24 February 2026 vs 03-12 February 2026.

Future Disclosure
Valeura intends to release its audited financial results for the year ended 31 December 2025, along with its annual information form for 2025 and its estimates of reserves and resources in accordance with the requirements of National instrument 51-101 – Standards of Disclosure for Oil and Gas Activities on 18 March 2026.

For further information, please contact:

Valeura Energy Inc. (General Corporate Enquiries)
Sean Guest, President and CEO
Yacine Ben-Meriem, CFO
Contact@valeuraenergy.com

+65 6373 6940

Valeura Energy Inc. (Investor and Media Enquiries)
Robin James Martin, Vice President, Communications and Investor Relations
IR@valeuraenergy.com

+1 403 975 6752 / +44 7392 940495

Contact details for the Company’s advisors, covering research analysts and joint brokers, including Auctus Advisors LLP, Beacon Securities Limited, Canaccord Genuity Ltd (UK), Cormark Securities Inc., Research Capital Corporation, Roth Canada Inc., and Stifel Nicolaus Europe Limited, are listed on the Company’s website at www.valeuraenergy.com/investor-information/analysts/.

About the Company

Valeura Energy Inc. is a Canadian public company engaged in the exploration, development and production of petroleum and natural gas in Thailand and in Türkiye. The Company is pursuing a growth-oriented strategy and intends to re-invest into its producing asset portfolio and to deploy resources toward further organic and inorganic growth in Southeast Asia. Valeura aspires toward value accretive growth for stakeholders while adhering to high standards of environmental, social and governance responsibility.

Additional information relating to Valeura is also available on SEDAR+ at http://www.sedarplus.ca.

Advisory and Caution Regarding Forward-Looking Information

Certain information included in this news release constitutes forward-looking information under applicable securities legislation. Such forward-looking information is for the purpose of explaining management’s current expectations and plans relating to the future. Readers are cautioned that reliance on such information may not be appropriate for other purposes, such as making investment decisions. Forward-looking information typically contains statements with words such as ‘anticipate’, ‘believe’, ‘expect’, ‘plan’, ‘intend’, ‘estimate’, ‘propose’, ‘project’, ‘target’ or similar words suggesting future outcomes or statements regarding an outlook.

Forward-looking information in this news release includes, but is not limited to, the Manora drilling results laying the basis for further development work in the future; and management’s expectation that the newly encountered reservoir intervals will be considered in the next evaluation of reserves and could therefore be additive to the ultimate potential and economic life of the asset.

Forward-looking information is based on management’s current expectations and assumptions regarding, among other things: political stability of the areas in which the Company is operating; continued safety of operations and ability to proceed in a timely manner; continued operations of and approvals forthcoming from governments and regulators in a manner consistent with past conduct; future drilling activity on the required/expected timelines; the prospectivity of the Company’s lands; the continued favourable pricing and operating netbacks across its business; future production rates and associated operating netbacks and cash flow; decline rates; future sources of funding; future economic conditions; the impact of inflation of future costs; future currency exchange rates; interest rates; the ability to meet drilling deadlines and fulfil commitments under licences and leases; future commodity prices; the impact of the Russian invasion of Ukraine; royalty rates and taxes; future capital and other expenditures; the success obtained in drilling new wells and working over existing wellbores; the performance of wells and facilities; the availability of the required capital to funds its exploration, development and other operations, and the ability of the Company to meet its commitments and financial obligations; the ability of the Company to secure adequate processing, transportation, fractionation and storage capacity on acceptable terms; the capacity and reliability of facilities; the application of regulatory requirements respecting abandonment and reclamation; the recoverability of the Company’s reserves and contingent resources; future growth; the sufficiency of budgeted capital expenditures in carrying out planned activities; the impact of increasing competition; the ability to efficiently integrate assets and employees acquired through acquisitions; global energy policies going forward; future debt levels; and the Company’s continued ability to obtain and retain qualified staff and equipment in a timely and cost efficient manner. In addition, the Company’s work programmes and budgets are in part based upon expected agreement among joint venture partners and associated exploration, development and marketing plans and anticipated costs and sales prices, which are subject to change based on, among other things, the actual results of drilling and related activity, availability of drilling, offshore storage and offloading facilities and other specialised oilfield equipment and service providers, changes in partners’ plans and unexpected delays and changes in market conditions. Although the Company believes the expectations and assumptions reflected in such forward-looking information are reasonable, they may prove to be incorrect.

Forward-looking information involves significant known and unknown risks and uncertainties. Exploration, appraisal, and development of oil and natural gas reserves and resources are speculative activities and involve a degree of risk. A number of factors could cause actual results to differ materially from those anticipated by the Company including, but not limited to: the ability of management to execute its business plan or realise anticipated benefits from acquisitions; the risk of disruptions from public health emergencies and/or pandemics; competition for specialised equipment and human resources; the Company’s ability to manage growth; the Company’s ability to manage the costs related to inflation; disruption in supply chains; the risk of currency fluctuations; changes in interest rates, oil and gas prices and netbacks; potential changes in joint venture partner strategies and participation in work programmes; uncertainty regarding the contemplated timelines and costs for work programme execution; the risks of disruption to operations and access to worksites; potential changes in laws and regulations, the uncertainty regarding government and other approvals; counterparty risk; the risk that financing may not be available; risks associated with weather delays and natural disasters; and the risk associated with international activity. See the most recent annual information form and management’s discussion and analysis of the Company for a detailed discussion of the risk factors.

The forward-looking information contained in this new release is made as of the date hereof and the Company undertakes no obligation to update publicly or revise any forward-looking information, whether as a result of new information, future events or otherwise, unless required by applicable securities laws. The forward-looking information contained in this new release is expressly qualified by this cautionary statement.

This news release does not constitute an offer to sell or the solicitation of an offer to buy securities in any jurisdiction, including where such offer would be unlawful. This news release is not for distribution or release, directly or indirectly, in or into the United States, Ireland, the Republic of South Africa or Japan or any other jurisdiction in which its publication or distribution would be unlawful.

Neither the Toronto Stock Exchange nor its Regulation Services Provider (as that term is defined in the policies of the Toronto Stock Exchange) accepts responsibility for the adequacy or accuracy of this news release.

This information is provided by Reach, the non-regulatory press release distribution service of RNS, part of the London Stock Exchange. Terms and conditions relating to the use and distribution of this information may apply. For further information, please contact rns@lseg.com or visit www.rns.com.

SOURCE: Valeura Energy Inc.

View the original press release on ACCESS Newswire

News Provided by ACCESS Newswire via QuoteMedia

This post appeared first on investingnews.com

Markets don’t usually hit record highs, risk falling into bearish territory, and spring back to new highs within six months. But that’s what happened in 2025.

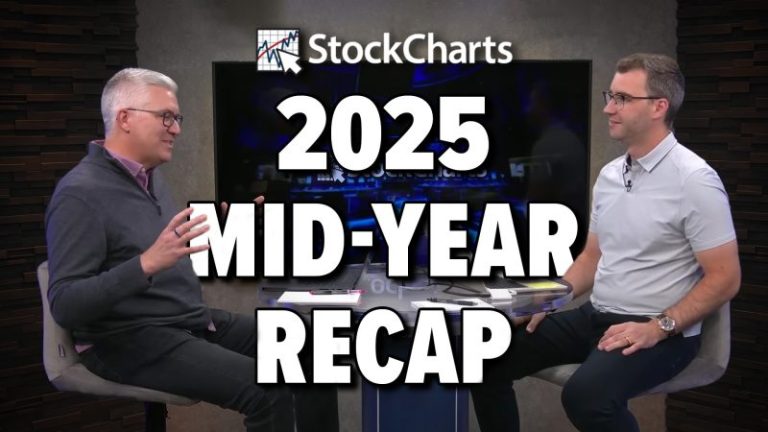
In this special mid-year recap, Grayson Roze sits down with David Keller, CMT, to show how disciplined routines, price-based signals, and a calm process helped them ride the whipsaw instead of getting tossed by it. You’ll see what really happened under the surface, how investor psychology drove the swings, and the exact StockCharts tools they leaned on to stay objective. 

If you’re focused on protecting capital, generating income, and sleeping well at night while still capturing the upside, this is a must-watch. Discover which charts deserve your attention now, what to ignore, and how to prep for the back half of 2025. 

This video premiered on July 23, 2025. Click on the above image to watch on our dedicated Grayson Roze page on StockCharts TV.

You can view previously recorded videos from Grayson at this link.