Author

admin

Browsing

Here are some charts that reflect our areas of focus this week at


XLU Leads with New High

Even though the Utilities SPDR (XLU) cannot keep pace with the Technology SPDR (XLK) and Communication Services SPDR (XLC), it is in a leading uptrend. XLU formed a cup-with-handle from November to July and broke to new highs the last two weeks. ETFs hitting new highs are in strong uptrends and should be on our radar.


Metal Mania in 2025

In a tribute to Ozzy, metals are leading the way higher in 2025. The PerfChart below shows year-to-date performance for the continuous futures for 12 commodities. Copper, Platinum and Palladium are up more than 45% year-to-date, while Gold is up 28.38% and Silver is up 35.30%. QQQ is up 10.52% year-to-date, but lagging these metals. The other commodities are mixed.


Multi-Year Highs for Silver and Copper

The next chart shows 11 year bar charts for five metals. Gold broke out in early 2024 and led the metals move with an advance the last 21 months. Silver and copper broke out to multi-year highs. Platinum broke above its 2021 high and Palladium got in the action with an 18 month high. There is a clear message here: metals are moving higher and leading as a group.  


Home Construction Hits Moment of Truth

The Home Construction ETF (ITB) hit its moment of truth as it rose to its falling 40-week SMA. Notice that ITB failed just below this moving average in August 2023. During the 2023-2024 uptrend, the 40-week SMA was more friendly as ITB reversed near this level in October 2023 and June 2024. ITB surged to the falling 40-week SMA in July, but the long-term trend is down and this area could be its nemesis.

Thanks for Tuning in!

See TrendInvestorPro.com for more


Is the market’s next surge already underway? Find out with Tom Bowley’s breakdown of where the money is flowing now and how you can get in front of it.

In this video, Tom covers key moves in the major indexes, revealing strength in transports, small caps, and home construction. He identifies industry rotation signals, which are pointing to aluminum, recreational products, and furnishings. Tom then demonstrates how to use StockCharts’ tools to scan for momentum stocks in emerging leadership groups — see why SGI tops Tom’s list. He ends with a discussion of post-earnings reactions from major names like GOOGL, TSLA, IBM, and LVS. 

And, of course, Tom wraps every idea with clear chart setups you can act on today. 

This video premiered on July 24, 2025. Click this link to watch on Tom’s dedicated page.

Missed a session? Archived videos from Tom are available at this link.

The S&P 500 ($SPX) just logged its fifth straight trading box breakout, which means that, of the five trading ranges the index has experienced since the April lows, all have been resolved to the upside.

How much longer can this last? That’s been the biggest question since the massive April 9 rally. Instead of assuming the market is due to roll over, it’s been more productive to track price action and watch for potential changes along the way. So far, drawdowns have been minimal, and breakouts keep occurring. Nothing in the price action hints at a lasting change — yet.

While some are calling this rally “historic,” we have a recent precedent. Recall that from late 2023 through early 2024, the index had a strong start and gave way to a consistent, steady trend.

From late October 2023 through March 2024, the S&P 500 logged seven consecutive trading box breakouts. That streak finally paused with a pullback from late March to early April, which, as we now know, was only a temporary hiccup. Once the bid returned, the S&P 500 went right back to carving new boxes and climbing higher.

New 52-Week Highs Finally Picking Up

If there’s been one gripe about this rally, it’s that the number of new highs within the index has lagged. As we’ve discussed before, among all the internal breadth indicators available, new highs almost always lag — that’s normal. What we really want to see is whether the number of new highs begins to exceed prior peaks as the market continues to rise, which it has, as shown by the blue line in the chart below.

As of Wednesday’s close, 100 S&P 500 stocks were either at new 52-week highs or within 3% of them. That’s a strong base. We expect this number to continue rising as the market climbs, especially if positive earnings reactions persist across sectors.

Even when we get that first day with 100+ S&P 500 stocks making new 52-week highs, though, it might not be the best time to initiate new longs.

The above chart shows that much needs to align for that many stocks to peak in unison, which has historically led to at least a short-term consolidation, if not deeper pullbacks — as highlighted in yellow. Every time is different, of course, but this is something to keep an eye on in the coming weeks.

Trend Check: GoNoGo Still “Go”

The GoNoGo Trend remains in bullish mode, with the recent countertrend signals having yet to trigger a greater pullback.

Active Bullish Patterns

We still have two live bullish upside targets of 6,555 and 6,745, which could be with us for a while going forward. For the S&P 500 to get there, it will need to form new, smaller versions of the trading boxes.

Failed Bearish Patterns

In the chart below, you can view a rising wedge pattern on the recent price action, the third since April. The prior two wedges broke down briefly and did not lead to a major downturn. The largest pullbacks in each case occurred after the S&P 500 dipped below the lower trendline of the pattern.

The deepest drawdown so far is 3.5%, which is not exactly a game-changer. Without downside follow-through, a classic bearish pattern simply can’t be formed, let alone be broken down from.

We’ll continue to monitor these formations as they develop because, at some point, that will change.

Byron King, editor at Paradigm Press, shares his approach to the gold and silver sectors as tensions in the Middle East intensify, also touching on oil and gas.

Overall he sees hard assets becoming increasingly key as global uncertainty escalates.

‘Own gold, own silver — physically own the metal for your own benefit,’ said King.

Securities Disclosure: I, Charlotte McLeod, hold no direct investment interest in any company mentioned in this article.

This post appeared first on investingnews.com

The United States added 119,000 jobs in September, a stronger-than-expected figure and a sign that the economy was adding jobs at a healthy clip before government shutdown.

But the details of the report from the Bureau of Labor Statistics paint a more mixed picture, that of a labor market that has recently begun to look wobblier amid high-profile layoff announcements from a host of blue-chip companies.

September’s employment gains were concentrated in health care, food and drinking establishments, and social assistance. Manufacturing shed 6,000 jobs, continuing a trend in a sector the Trump administration has touted as a key target of its economic policies. Transportation and warehousing also lost 25,300 jobs.

The unemployment rate climbed from 4.3% to 4.4% in September, though the pickup was due in part to an increase in the labor force, which the BLS said gained 450,000 new potential workers.

The pace of wage growth slowed.

Thursday’s report was originally supposed to be released Oct. 3, but it was shelved because of the government shutdown. Jobs data collected for October will be released Dec. 16 as part of the full report covering November, the BLS said Wednesday.

The absence of official economic reports over the past six weeks has made it difficult to accurately assess the current state of the jobs market.

But data from private and alternative sources has painted a worrisome portrait amid signs of softening consumption among many households and stubborn price increases.

Over the past few weeks, Amazon, General Motors, IBM, Microsoft, Paramount, Target and UPS have announced plans to eliminate tens of thousands of jobs. Their ranks were joined Thursday by Verizon, which announced the start of layoffs affecting 13,000, according to an internal memo.

About 39,000 workers received layoff notices in October, according to data tracked by the Cleveland Federal Reserve — a number last seen in May and before that only during times of crisis.

A separate report released this month by the research firm Challenger, Gray & Christmas counted 153,000 job cuts announced in October, though some analysts give less weight to its data over methodology questions.

Whatever the exact total, those who do find themselves without work are now experiencing an average unemployment spell of 24.5 weeks — nearly six months. That’s the worst reading since November 2017.

Tiffany Price, South Florida general manager for Job News USA, a job listings service, said many companies face budget cuts and have effectively frozen hiring. And what companies are still hiring are offering lower compensation rates that more experienced workers may have trouble accepting.

The number of employers who attended a recent Job News jobs fair at Amerant Bank Arena in Broward County, Florida, was nearly half the figure of a year ago, while attendance among workers held steady at about 2,000 potential applicants, Price said.

Still, many organizations report difficulties finding qualified workers, she said. On both the employer and the employee sides, a “post and pray” job application strategy has taken hold that leads to worse outcomes for both, she said. More successful outcomes on both fronts have come from local relationships and face-to-face outreach.

A bright spot has been local government, Price said — something that is reflected in the national data, which shows employment in local government roles has continuously expanded since the Covid-19 pandemic recovery set in.

“It’s a weird market,” she said.

Questions about the health of the labor market now dominate discussions about whether the Federal Reserve should continue to cut interest rates. On Monday, Fed Governor Christopher Waller said a December cut was needed to stem further job-market deterioration.

“My focus is on the labor market, and after months of weakening, it is unlikely that the September jobs report later this week or any other data in the next few weeks would change my view that another cut is in order,” he said.

In his speech last month announcing a 0.25% rate cut, Federal Reserve Chair Jerome Powell was more circumspect, saying it appeared that the jobs market was weakening only gradually and signaling he was not ready to guarantee a December rate cut was inevitable.

The Fed’s divisions were laid bare in meeting notes released Wednesday from the October rate-setting meeting that showed a sharp split among policymakers about the risk that lower rates would spur already-elevated inflation by making it easier for consumers and businesses to borrow money.

“Most participants noted that, against a backdrop of elevated inflation readings and a very gradual cooling of labor market conditions, further” interest-rate cuts “could add to the risk of higher inflation becoming entrenched,” the notes said.

So far, many economic analysts have been reluctant to call it a full-blown jobs crisis, pointing to data from state-level claims for unemployment that remain subdued and recent reports from the payrolls processor ADP showing a slight rebound in new hires.

“Fears of a renewed labour market downturn, amid reports of mass layoffs at several large firms, are not reflected in still-muted jobless claims or the pick-up in hiring in the ADP private payrolls report,” Thomas Ryan, North America economist for Capital Economics research group, wrote in a note published last week.

This post appeared first on NBC NEWS

Shoppers are still flocking to Walmart.

The company raised its full-year earnings and sales outlook Thursday, heading into the crucial holiday shopping season.

Walmart also offered fresh signs that it is shedding its original identity as a strictly down-market brick-and-mortar operation by growing its e-commerce business and increasing its market share of higher-income shoppers.

Walmart’s shares closed more than 6% higher Thursday, even as the broader market suffered a dramatic sell-off. The stock is up more than 18% this year.

The biggest retailer and grocer in the United States acknowledged the added financial pressures on lower-income households but said middle-income families are holding up. Walmart saw more sales growth in its grocery and health and wellness product categories than in general merchandise.

‘As pocketbooks have been stretched, you’re seeing more consumer dollars go to necessities versus discretionary items,’ Chief Financial Officer John David Rainey said on a call with analysts Thursday morning.

The company reported that same-store sales for Walmart U.S. rose 4.5% in the quarter that ended Oct. 31, exceeding analysts’ expectations.

“The team delivered another strong quarter across the business. eCommerce was a bright spot again this quarter. We’re gaining market share, improving delivery speed, and managing inventory well,” outgoing CEO Doug McMillon said in a statement.

Walmart reported 27% growth in e-commerce sales globally.

Walmart also announced that it will move from trading on the New York Stock Exchange to the tech-heavy Nasdaq next month. It’s the latest sign of America’s largest private employer working to position itself as tech-forward in order to compete with Amazon.

The discounter’s third-quarter earnings come amid growing questions about whether Americans contending with tariffs, corporate layoffs and accelerating inflation are still confidently spending on retail.

As a bellwether for the U.S. economy and consumer confidence, Walmart’s strong earnings and guidance indicate that consumers are still shopping — at least at the lower end of the retail price point.

The company announced last week that McMillon will step down in January. McMillon, 59, started at Walmart as an associate in the 1980s and has helmed the company since 2014.

Under his leadership, Walmart improved pay and benefits for many employees, renovated hundreds of stores and boosted its e-commerce and delivery programs, especially during the Covid pandemic.

John Furner, CEO of Walmart U.S., will take over the top job Feb. 1. Since 2019, Furner has led Walmart’s American operations — by far the largest slice of the company, with around 1.6 million of Walmart’s approximately 2.1 million total associates worldwide.

Walmart is leading the retail race against longtime rival Target, which Wednesday reported a drop in third-quarter sales and cut its full-year profit guidance.

Target’s sales have faltered over the last few years, with some consumers expressing frustration over what they said were disorganized stores and rollbacks of the company’s diversity, equity and inclusion initiatives.

In October, Target said it would cut about 1,800 corporate jobs.

Target is hoping for a fresh start in the new year. Incoming CEO Michael Fiddelke will take over Feb. 1, the same day Furner becomes CEO of Walmart.

The struggling retailer said Wednesday that it plans to increase its investment in stores and technology next year by 25%.

Since January, U.S. businesses have had to contend with ever-changing tariffs under the Trump administration. Walmart has navigated the uncertainty by raising prices on some items, while swallowing some tariff costs on others. In the three months that ended Oct. 31, prices at Walmart U.S. rose around 1% overall, with higher prices on electronics, toys and seasonal items in particular due to tariff pressures.

In the grocery section, Walmart expects egg prices to drop but anticipates the record-breaking beef prices will stay high, in part from cattle herds shrinking over the last few decades.

Prices for other grocery staples are also up, though the Trump administration’s rollback of tariffs on many food items last week could offer some relief.

Despite the rising prices, Walmart is offering its annual Thanksgiving menu deal for 10 at less than $4 per person. It’s less expensive than last year’s package, but it also contains fewer items.

The company is also expanding its use of artificial intelligence, teaming up with OpenAI to allow customers to buy from Walmart within ChatGPT. Walmart has not detailed the terms of the partnership or shared when the new option could be available.

This week, Target announced its own collaboration with OpenAI.

Walmart has lagged behind rival Amazon in AI-driven e-commerce — Amazon debuted its Rufus shopping assistant in February 2024, more than a year before Walmart launched its counterpart, Sparky.

This post appeared first on NBC NEWS
Markets don’t usually hit record highs, risk falling into bearish territory, and spring back to new highs within six months. But that’s what happened in 2025.

In this special mid-year recap, Grayson Roze sits down with David Keller, CMT, to show how disciplined routines, price-based signals, and a calm process helped them ride the whipsaw instead of getting tossed by it. You’ll see what really happened under the surface, how investor psychology drove the swings, and the exact StockCharts tools they leaned on to stay objective. 

If you’re focused on protecting capital, generating income, and sleeping well at night while still capturing the upside, this is a must-watch. Discover which charts deserve your attention now, what to ignore, and how to prep for the back half of 2025. 

This video premiered on July 23, 2025. Click on the above image to watch on our dedicated Grayson Roze page on StockCharts TV.

You can view previously recorded videos from Grayson at this link.

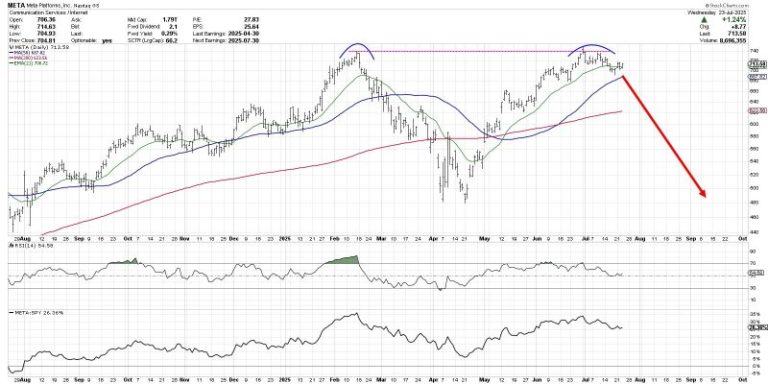
The chart of Meta Platforms, Inc. (META) has completed a roundtrip from the February high around $740 to the April low at $480 and all the way back again.  Over the last couple weeks, META has now pulled back from its retest of all-time highs, leaving investors to wonder what may come next.

Is this the beginning of a new downtrend phase for META?  Or just a brief pullback before a new uptrend phase propels META to new all-time highs?

Today we’ll look at two potential scenarios, including the double top pattern and the cup and handle pattern, and share which technical indicators and approaches could help us determine which path plays out into August.

The double top scenario basically means that the late July retest of the previous all-time high was the end of the recent uptrend phase.  The double top pattern is literally when a major resistance level is set and then retested.  The implication is that a lack of willing buyers means the uptrend is exhausted, and there is nowhere to go but down.

While the 21-day exponential moving average is currently in play for META, I would say that a break below the 50-day moving average could confirm this as the correct scenario.  If that smoothing mechanism does not hold, then the price action would imply less of a pullback and more like the beginning of a real distribution phase.

What is META pulls back but then resumes an uptrend phase, leading META to another new all-time high?  That would result in a confirmed cup and handle pattern, created by a large rounded bottoming pattern followed by a brief pullback.  The key to this pattern is the “rim” of the cup, which sits right at $740 for META.

Given the pullback META has demonstrated so far in July, I would say that a break above the $740 level would basically confirm a bullish cup and handle pattern.  That would suggest much more upside potential for META, as the stock would literally go into previously uncharted territory.

So how can we determine which scenario is more likely to play out?  This is where we need to incorporate more technical indicators into the discussion, as a way to further validate and confirm our investment thesis.

Just to review, I think a break above $740 would confirm a bullish cup and handle pattern.  I would also say that a break below the $680 level, which would represent a move below the 50-day moving average as well as the June swing lows, would basically confirm a bearish double top pattern.

We can also use the Relative Strength Index (RSI) to help determine whether META remains in a bullish trend phase.  During bull phases, the RSI rarely gets below 40, because buyers usually step in to “buy the dips” and keep the momentum fairly constructive.  So if the price would break down, and the RSI would not hold that crucial 40 level, that could mean a bearish outlook is warranted.

Finally, we can use volume-based indicators to assess whether moves in the price are supported by stronger volume readings.  Here I’ve included the Accumulation/Distribution Line, which tracks the trend in daily volume readings over time.  We can see that the high in July resulted in a divergence, as the A/D line was trending lower.  If the A/D line would break below its June and July lows, marked by a dashed red line, that would represent a bearish volume reading for META.

Technical analysis is less about predicting the future, and more about determining the most probable scenarios based on our analysis of trend, momentum, and volume.  I hope this discussion shows how the outlook for META can be easily determined and tracked using the best practices of technical analysis!

RR#6,

Dave

PS- Ready to upgrade your investment process?  Check out my free behavioral investing course!

David Keller, CMT

President and Chief Strategist

Sierra Alpha Research LLC

marketmisbehavior.com

https://www.youtube.com/c/MarketMisbehavior

Disclaimer: This blog is for educational purposes only and should not be construed as financial advice.  The ideas and strategies should never be used without first assessing your own personal and financial situation, or without consulting a financial professional.  

The author does not have a position in mentioned securities at the time of publication.    Any opinions expressed herein are solely those of the author and do not in any way represent the views or opinions of any other person or entity.

Is the market’s next surge already underway? Find out with Tom Bowley’s breakdown of where the money is flowing now and how you can get in front of it.

In this video, Tom covers key moves in the major indexes, revealing strength in transports, small caps, and home construction. He identifies industry rotation signals, which are pointing to aluminum, recreational products, and furnishings. Tom then demonstrates how to use StockCharts’ tools to scan for momentum stocks in emerging leadership groups — see why SGI tops Tom’s list. He ends with a discussion of post-earnings reactions from major names like GOOGL, TSLA, IBM, and LVS. 

And, of course, Tom wraps every idea with clear chart setups you can act on today. 

This video premiered on July 24, 2025. Click this link to watch on Tom’s dedicated page.

Missed a session? Archived videos from Tom are available at this link.

The S&P 500 ($SPX) just logged its fifth straight trading box breakout, which means that, of the five trading ranges the index has experienced since the April lows, all have been resolved to the upside.

How much longer can this last? That’s been the biggest question since the massive April 9 rally. Instead of assuming the market is due to roll over, it’s been more productive to track price action and watch for potential changes along the way. So far, drawdowns have been minimal, and breakouts keep occurring. Nothing in the price action hints at a lasting change — yet.

While some are calling this rally “historic,” we have a recent precedent. Recall that from late 2023 through early 2024, the index had a strong start and gave way to a consistent, steady trend.

From late October 2023 through March 2024, the S&P 500 logged seven consecutive trading box breakouts. That streak finally paused with a pullback from late March to early April, which, as we now know, was only a temporary hiccup. Once the bid returned, the S&P 500 went right back to carving new boxes and climbing higher.

New 52-Week Highs Finally Picking Up

If there’s been one gripe about this rally, it’s that the number of new highs within the index has lagged. As we’ve discussed before, among all the internal breadth indicators available, new highs almost always lag — that’s normal. What we really want to see is whether the number of new highs begins to exceed prior peaks as the market continues to rise, which it has, as shown by the blue line in the chart below.

As of Wednesday’s close, 100 S&P 500 stocks were either at new 52-week highs or within 3% of them. That’s a strong base. We expect this number to continue rising as the market climbs, especially if positive earnings reactions persist across sectors.

Even when we get that first day with 100+ S&P 500 stocks making new 52-week highs, though, it might not be the best time to initiate new longs.

The above chart shows that much needs to align for that many stocks to peak in unison, which has historically led to at least a short-term consolidation, if not deeper pullbacks — as highlighted in yellow. Every time is different, of course, but this is something to keep an eye on in the coming weeks.

Trend Check: GoNoGo Still “Go”

The GoNoGo Trend remains in bullish mode, with the recent countertrend signals having yet to trigger a greater pullback.

Active Bullish Patterns

We still have two live bullish upside targets of 6,555 and 6,745, which could be with us for a while going forward. For the S&P 500 to get there, it will need to form new, smaller versions of the trading boxes.

Failed Bearish Patterns

In the chart below, you can view a rising wedge pattern on the recent price action, the third since April. The prior two wedges broke down briefly and did not lead to a major downturn. The largest pullbacks in each case occurred after the S&P 500 dipped below the lower trendline of the pattern.

The deepest drawdown so far is 3.5%, which is not exactly a game-changer. Without downside follow-through, a classic bearish pattern simply can’t be formed, let alone be broken down from.

We’ll continue to monitor these formations as they develop because, at some point, that will change.